
Silver Price Forecast:
- It’s been a big summer for precious metals.
- Silver prices gained as much as 68% during the month of July while Gold prices put in a more paltry 18% peak gain.
- For much of August both Gold and Silver prices have been beset by correction; but after a big area of support came into play ahead of tomorrow’s Jackson Hole kick-off, the question is whether buyers are positioning for another run towards the 30-handle.
- Appearing to play a role here in Silver price action is the 30-level, which is considered a psychological level. This is taught as part of DailyFX Education.
Silver Breaks Out – but Can Bulls Drive?
It’s been a big summer for metals and, well, a number of other physical assets that have gained en masse as the US government launched a trove of measures designed to offset the inevitable business slowdown that followed the coronavirus-drive lockdowns. As most economies continue to hobble with the aim of a ‘V-shaped’ recovery, the one aspect that’s remained clear is that global governments were going to do whatever they could try to offset the economic ills of the pandemic. In many cases, this involved ushering out the printing presses again, and with that prospect of monetary dilution came the potential for gains in hard assets that could simply be diluted: Hard assets such as Gold and Silver.
And its been a big year already for Gold. This was my ‘top trade idea’ for 2020, and Gold prices really went to work in the pandemic backdrop, quickly rushing up to a fresh all-time-high. And while this has gotten a lot of attention, especially of recent as that new high came into play, the move in Silver prices has actually been even more pronounced as July saw Silver prices gain as much as 68% while Gold was looking at a more paltry 18% figure over the same period of time.
But, like most market cycles, little is linear, and more recently prices in both Gold and Silver have settled around some key areas of support. A few weeks ago, I published the article Silver Slices Through Support, Bulls Aim for Recovery; largely focusing on the potential for buyers to jump back in and continue that prior trend.
And while buyers did pose a bullish breakout, as yet, that longer-term trend remains in wait as price action continues to show recent hints of digestion. My colleague Tammy Da Costa focused in on the matter in an article earlier this week, highlighting how just a minor amount of USD strength has been able to keep Silver prices pinned down towards support.
Since then, buyers have shown a bit more motivation and price action has pushed above a key area of short-term resistance. That resistance shows around the 27 handle, which had held the highs earlier this week before price action reverted to confluent support. And that support is the same zone that was looked at as short-term resistance a few weeks ago, just ahead of the short-term bullish breakout in Silver.
Silver Hourly Price Chart

Chart prepared by James Stanley; Silver on Tradingview
The big question at this point is the bigger picture trend: Are buyers going to be able to get back in the drivers’ seat to produce a move resembling anything like July price action? Taking a step back to look at the daily chart, and a point of potential resistance shows around the 30 big figure, which seems to have had some pull when prices topped-out in early-August. Silver came within 14 cents of hitting that 30-level, and the fact that it didn’t highlights bulls’ lack of conviction at the time, and given the severity of the move a bit of hesitation might make sense.
Also of interest as Silver prices have begun to move-higher, RSI on the daily chart is no longer in overbought territory.
Silver Daily Price Chart
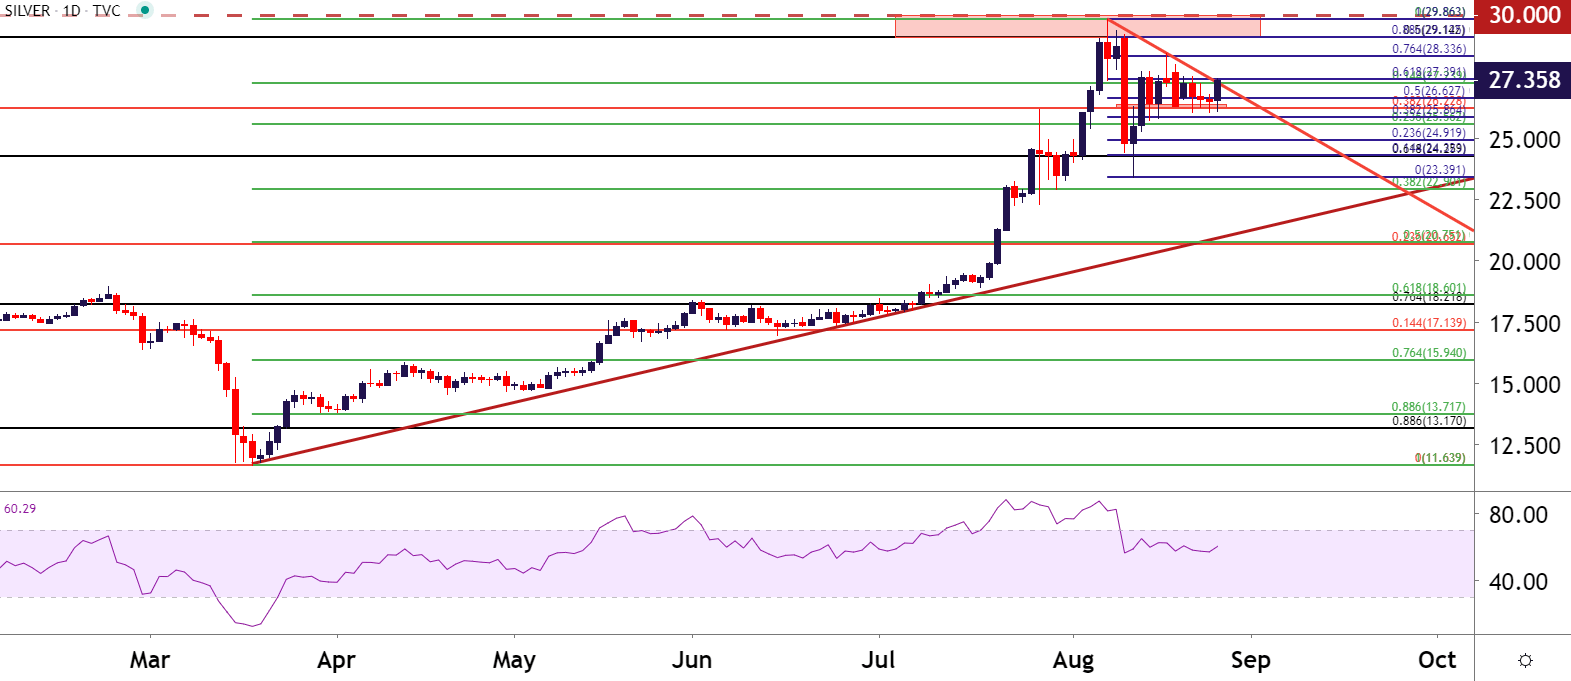
Chart prepared by James Stanley; Silver on Tradingview
But now that price action has spent much of August re-loading, the question is whether or no buyers are finally ready to encounter that 30 handle?
On a shorter-term basis, a Fibonacci retracement produced by the August pullback can provide some framework moving forward. The 61.8% retracement of the pullback move is currently helping to hold resistance, and a breach above opens the door for a push up to the 76.4% marker, which is confluent with last week’s swing high, taken from around the price of 28.34. Beyond that, the prior highs come into view, with a bit of confluence around the 28.15 area on the chart before the 29.86 prior high and the 30 psychological level.
Silver Four-Hour Price Chart
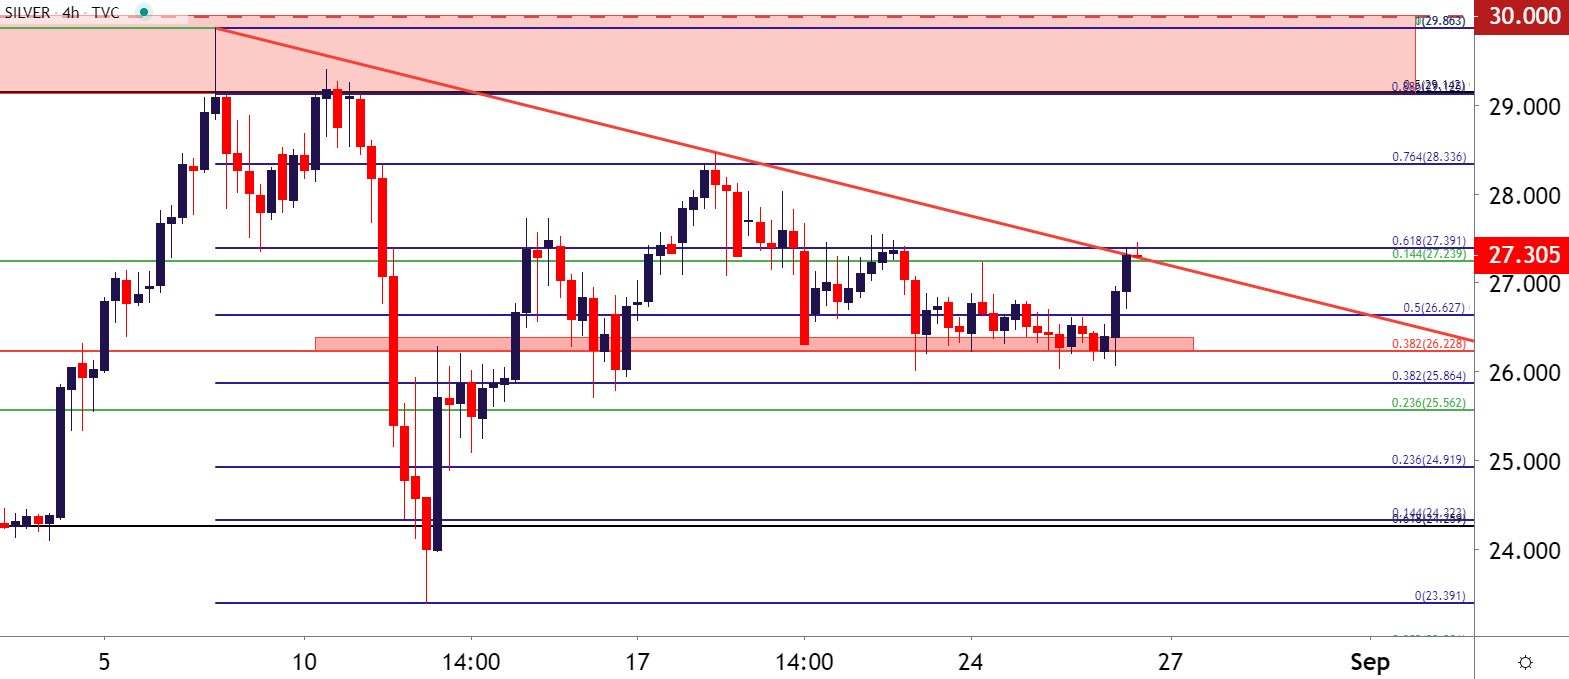
Chart prepared by James Stanley; Silver on Tradingview
--- Written by James Stanley, Strategist for DailyFX.com
Contact and follow James on Twitter: @JStanleyFX