

S&P 500 Talking Points
- We’re now just a week away from the election, and US equities kicked-off the week with a nasty sell-off.
- Are stocks readying for a major turn? It’s still too early to say, and the S&P 500 is grasping on to a bullish continuation pattern that remains.
- The analysis contained in article relies on price action and chart formations along with the bull flag at the center of today’s discussion. To learn more about price action or chart patterns, check out our DailyFX Education section.
We’re now just a week away from the election and this week opened with some aggressive risk aversion as US equities spilled lower on Monday. That pullback came to a big support zone on the chart that, at this point, has helped to hold the lows.
But, with a pensive Presidential Election just around-the-corner and a stimulus package that continues to get teased through headlines, the question remains as to whether we’re at the precipice of a significant change in market direction. While the past eight months have seen headlines filled with fear and uncertainty, stock traders haven’t really felt much of that as US equities have ridden a rocket ship to fresh all-time-highs. At the source of that move has been a plethora of stimulus, along with the expectation for more, as Central Banks and governments hustle together to support the economy through the continued battle against Covid-19.
To put matters in scope: The S&P 500 sold off by a hair under 36% from the Feb high to the March lows. But after those March lows – prices gained more than 64% up to those September highs. That’s 64% in less than six months, an astounding stretch by any measure made far more impressive considering the context.
But since those September highs, matters have begun to shift. September brought upon a strong US Dollar as equities began to stumble; but buyers got back in the driver’s seat in late-September and pushed through the first couple weeks of October. But – since then, another potential shift as buyers haven’t been able to substantiate much of a run and prices have channeled lower in the S&P 500.
To learn more about bullflags, check out our DailyFX Education section.
S&P 500 Four-Hour Price Chart
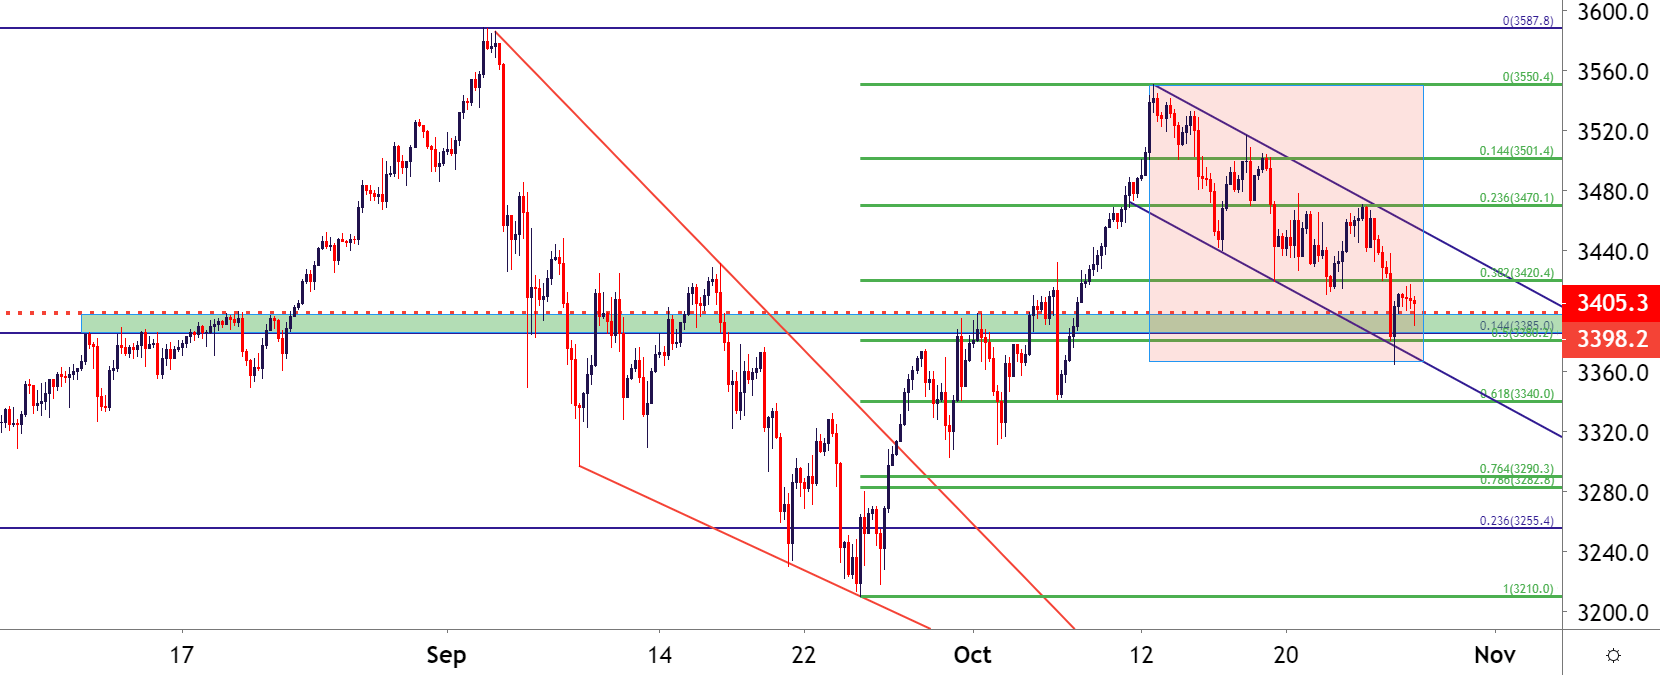
Chart prepared by James Stanley; SPX500 on Tradingview
S&P Holds at Big Support Zone
Given current context, that downward-sloping channel looked at above is a bull flag formation. Such formations will often be approached with the aim of bullish continuation.
Making matters a bit more interesting is confluence around this current zone of support. You might notice from the above chart that this is the same zone that came in as resistance in mid-August. Well, this was also the prior all-time-high, setting the barrier back in February before the Covid-fueled sell-off came into the equation. This area also contains a host of Fibonacci retracement levels, including the 14.4% retracement of the March-September run and the 50% marker of the September-October bullish bounce.
S&P 500 Daily Price Chart: We’re at a Big Level
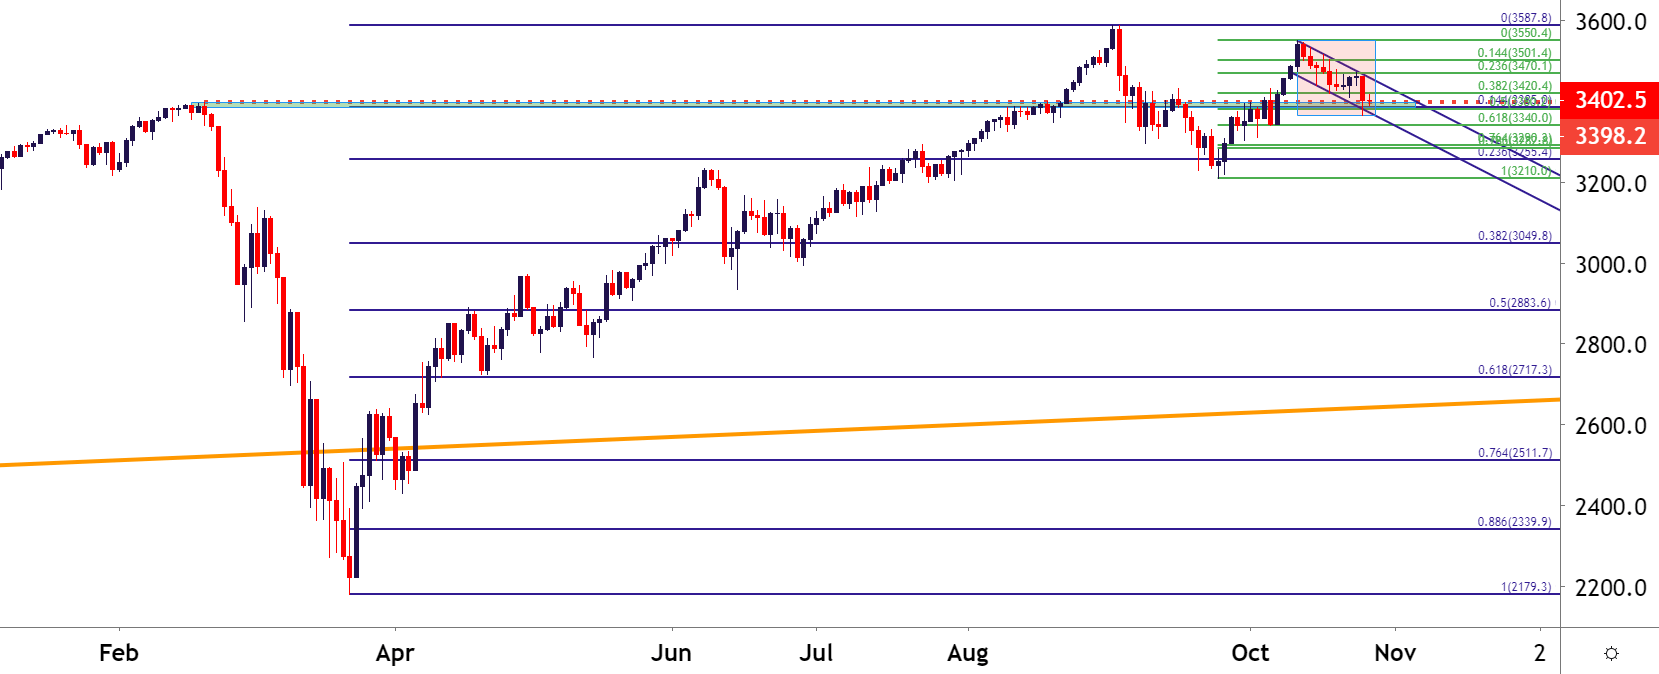
Chart prepared by James Stanley; SPX500 on Tradingview
S&P 500 Strategy Moving Forward
The headlines are nasty. The social items are discouraging. And this upcoming election, well it can keep the headlines nasty for the near-term. But, at this point, the door can remain open for bullish continuation as taken from the above two charts and a hold of support in the current region.
However, with that being said, we’re about to see some ‘new’ events transpire. Markets generally abhor uncertainty and these new items may bring such. So, in effort of preparation, I’m sharing three levels of note both above and below current price action so that traders can approach the matter in a manner befitting of their approach.
Underneath current prices: The 61.8% retracement of the September-October bounce is at 3,340 and this was a swing-low a couple of weeks ago. Below that, 3,330 looms large, as there were a number of prior price action swings down there. Below that, matters are a bit messier, with possible supports around 3,250 and the September low around 3,210.
Above current price action: Near-term resistance plots around prior support at 3,240; and this is the 38.2% retracement of the September-October bounce. Above that, the 23.6% retracement from that same study had previously caught resistance last week and a push-above that level around 3,470 would entail a bullish break of the bull flag formation; at which point bullish continuation will look considerably more attractive. Follow-through targets could be sought around 3,500, 3,550 and then the all-time-high at 3,587.
S&P 500 Four-Hour Price Chart
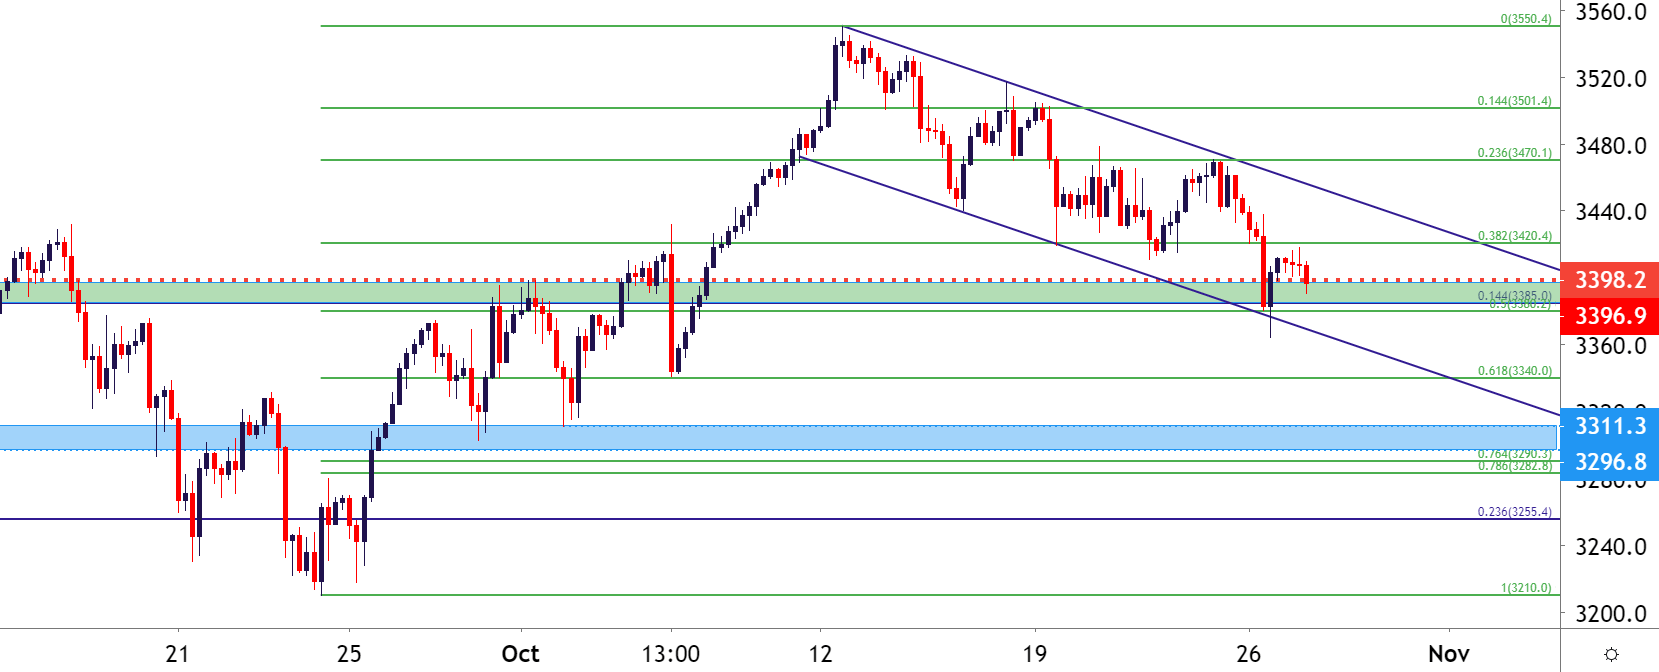
Chart prepared by James Stanley; SPX500 on Tradingview
--- Written by James Stanley, Strategist for DailyFX.com
Contact and follow James on Twitter: @JStanleyFX