

Nasdaq 100 Index, Congress, Fiscal Stimulus, Covid-19 – Talking Points:
- Month-end flows and a heated US presidential debate hampered global equity markets during Asia-Pacific trade.
- Congressional stimulus impasse may limit the recent recovery seen across US benchmark equity indices.
- Nasdaq 100 index poised to move lower as price struggles to break above key chart resistance.
Asia-Pacific Recap
Australia’s benchmark ASX 200 index collapsed 1.8% during Asia-Pacific trade despite robust Chinese data, as month-end flows and a heated US presidential debate weighed on global risk assets.
The haven-associated Japanese Yen and US Dollar gained against their major counterparts, while the risk-sensitive Australian Dollar dipped 0.25%.
Gold slipped lower and silver plunged just under 2% even though yields on US 10-year Treasuries held firm at 0.65%.
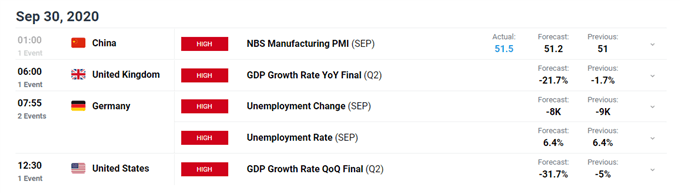
Looking ahead, German unemployment data for the month of September and US second quarter GDP headline the economic docket.
Congressional Stimulus Impasse Limiting Nasdaq 100 Rebound
As noted in previous reports, House Speaker Nancy Pelosi’s recent comments suggesting that a much-needed fiscal stimulus package could still be delivered before the US Presidential Election in November may underpin risk-sensitive assets in the near-term.
Pelosi stated that Democrats will put forward a new proposal in the coming days and that she trusts “Secretary Mnuchin to represent something that can reach a solution, and I believe we come to an agreement”, adding that “what we will be putting forth is a proffer to say, now let us negotiate within a time frame and dollar amount to get the job done”.
However, it remains to be seen if US policymakers can see eye-to-eye given Democrats are calling for at least $2.2 trillion in new aid and President Donald Trump has stated that he would only go as high as $1.5 trillion.
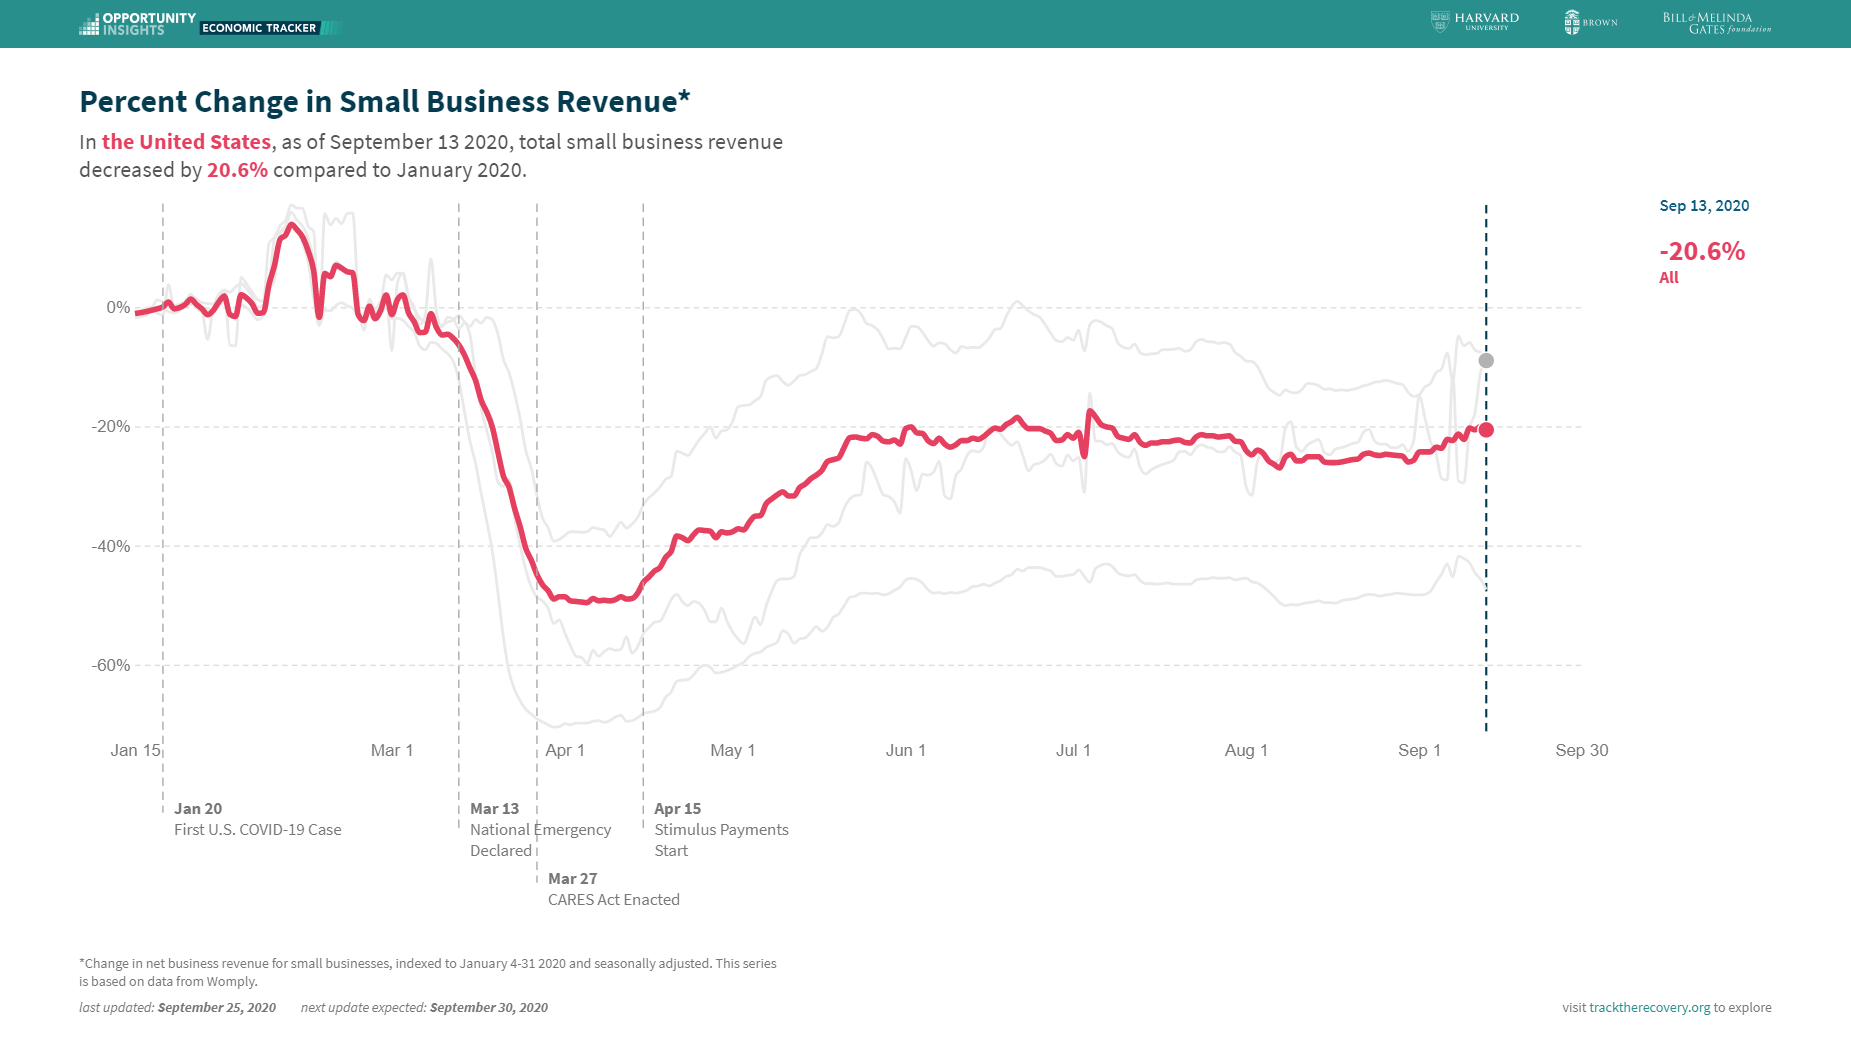
Nevertheless, with small business revenue in the United States notably plateauing at 20.6% below pre-coronavirus levels – since peaking in early July – and continuing jobless claims hovering at levels almost 3 times higher than the peak seen during the 2008 global financial crisis, the lack of additional stimulus appears to be significantly hampering the nation’s nascent economic recovery.
Moreover, the impact of over 40,000 Covid-19 infections daily is reflected in high-frequency data, with all three mobility data points – driving, walking and transit – continuing to slide lower after peaking at the end of August.
To that end, the short-term outlook for US benchmark equity indices may hang on Congressional stimulus negotiations, with the successful delivery of an all-encompassing fiscal aid package probably driving the Nasdaq 100 index back to fresh yearly highs.
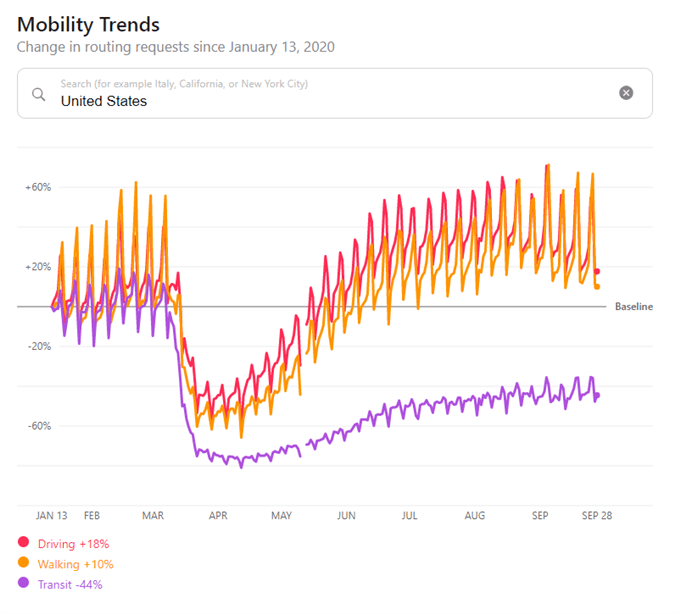
Source – Apple Mobility Data
Nasdaq 100 Futures Daily Chart – Bear Flag Hints at Further Losses
From a technical perspective, the tech-heavy Nasdaq 100 index looks poised to extend its fall from the record high set on September 2 (12465.25), despite clambering back above the trend-defining 50-day moving average (11251) in recent days.
In fact, with price carving out a Bear Flag continuation pattern and volume failing to confirm the recent rebound from the monthly low (10656.5), the path of least resistance seems skewed to the downside.
Inability to break above key resistance at the September 16 high (11539) could intensify selling pressure and generate a push back towards the 100-DMA (10592), with a daily close below probably validating the bearish continuation pattern and bringing the psychologically pivotal 10000 level into focus.
Conversely, a daily close above the 11500 mark may encourage would-be buyers and generate a push back towards the August 27 high (12046), with a break above opening a path to test the yearly high (12465.25).
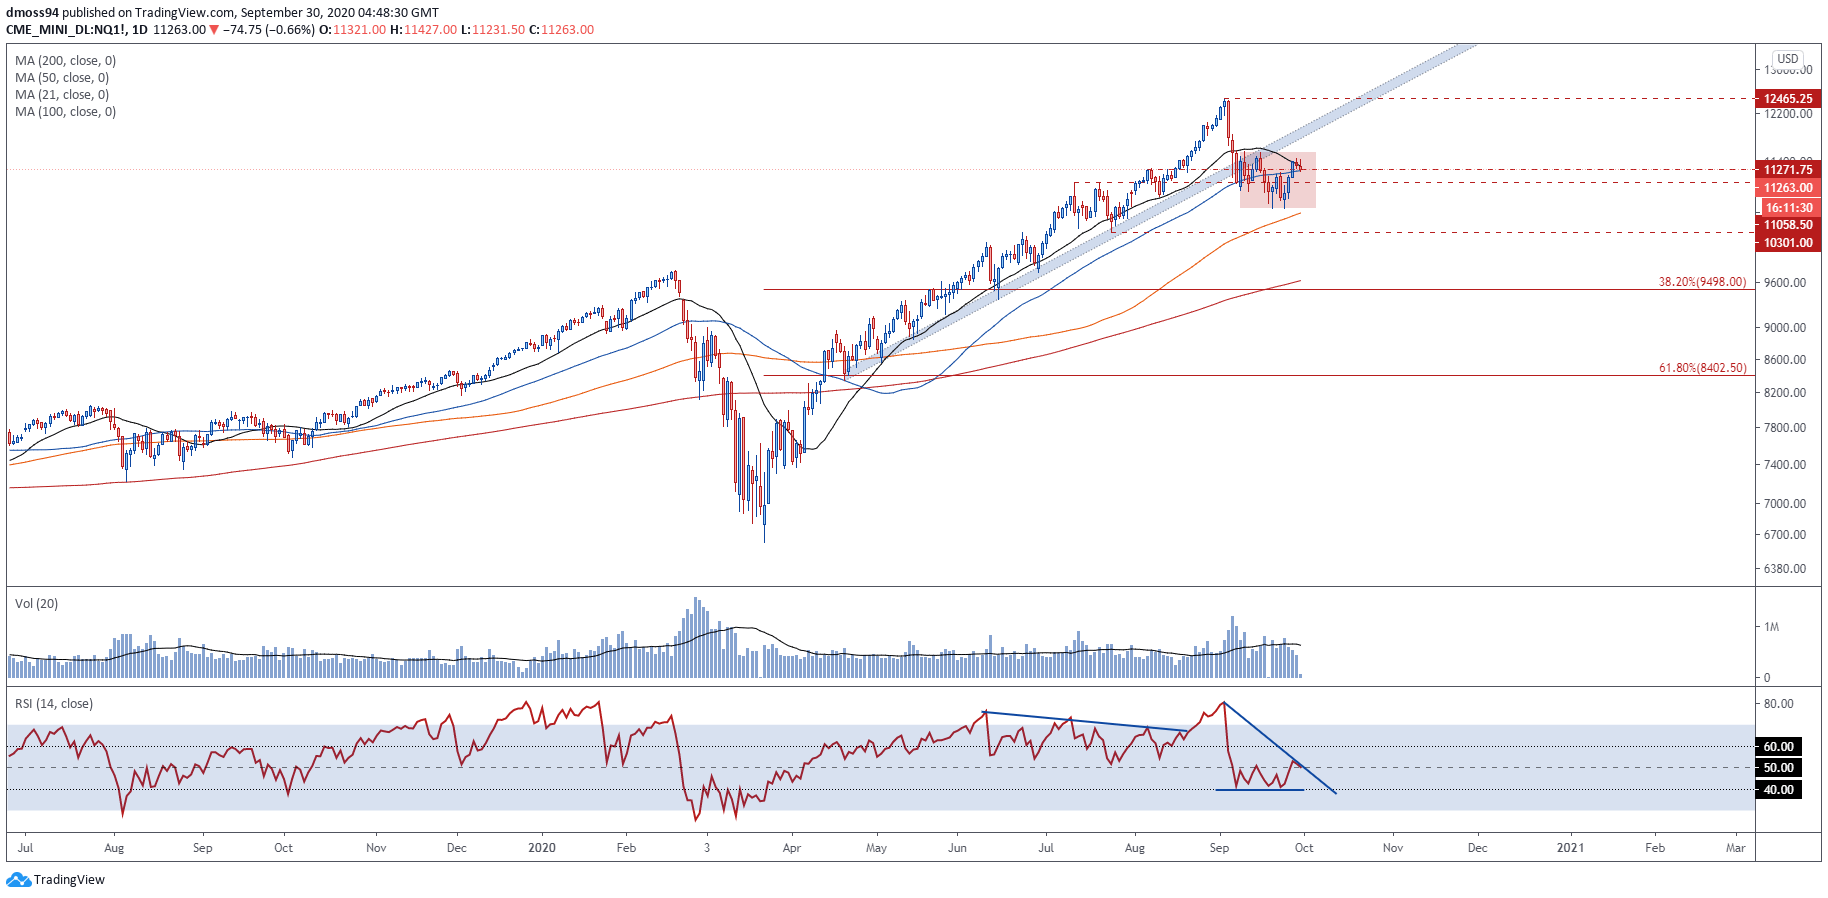
Nasdaq 100 futures daily chart created using TradingView
Nasdaq 100 Futures 4-Hour Chart – 200-MA Stifling Buying Pressure
Zooming into a 4-hour chart reinforces the bearish outlook depicted on a daily timeframe, as confluent resistance at the 200-MA (11440) and downtrend extending from the yearly high (12465.25) suppresses bullish momentum.
Moreover, with the RSI swerving away from oversold territory and crashing back below 60, a push back towards the monthly low (10656.5) could be in the making.
That being said, with price still tracking above the 100-MA and continuing to respect the short-term uptrend that has guided price higher since the September 24 low (10660.25), a push above Bear Flag resistance (11550) could eventuate in the coming days.
Nevertheless, an extension of the fall from the yearly high looks the more likely scenario if the 200-MA (11440) continues to stifle buying pressure, with a break below the 100-MA (11176) probably resulting in a retest of the monthly low (10656.6).
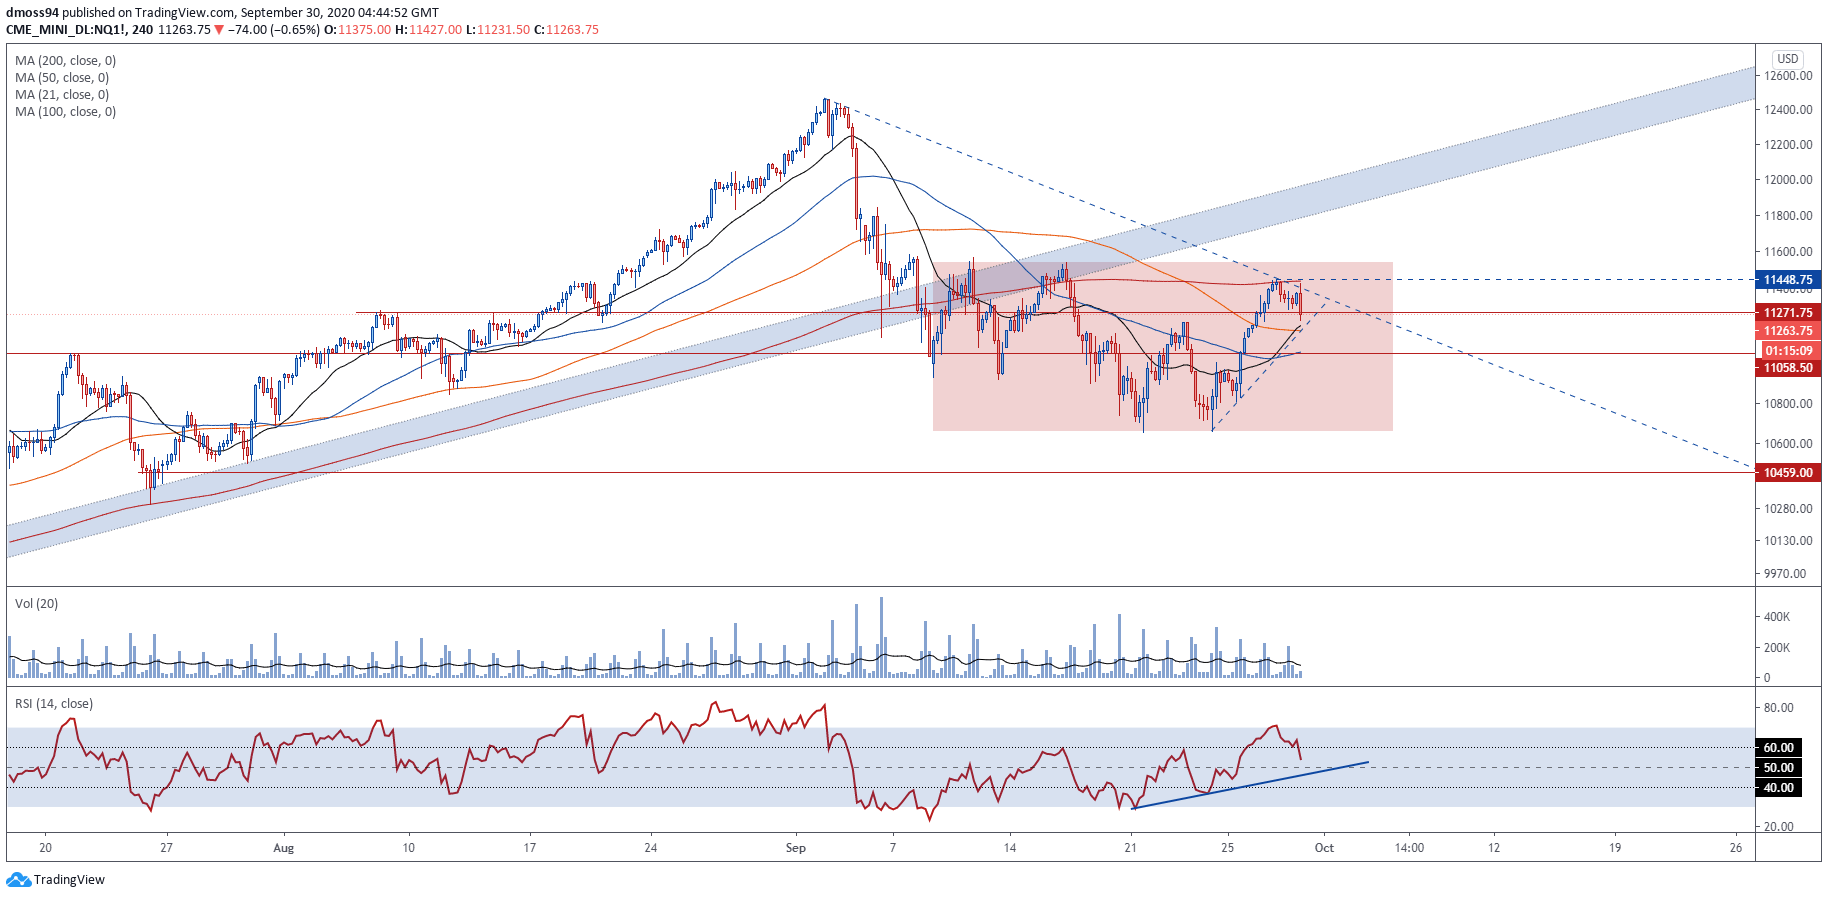
Nasdaq 100 futures 4-hour chart created using TradingView
-- Written by Daniel Moss, Analyst for DailyFX
Follow me on Twitter @DanielGMoss