
Nasdaq 100, Covid-19 Vaccine, Biden Administration, Sectoral Rotation – Talking Points:
- Equity markets broadly slid lower during APAC trade.
- Fading vaccine optimism may fuel rotation back into technology sector.
- Nasdaq 100 index carving out Bull Pennant formation. Is a topside break in the offing?
Asia-Pacific Recap
The rally across global equity markets seemed to pause for breath during Asia-Pacific trade, as investors digested the worrying increase of coronavirus infection in several developed nations. Australia’s ASX 200 index slipped 0.49% and Hong Kong’s Hang Seng index fell 0.24%.
The haven-associated US Dollar and Japanese Yen gained ground against their major counterparts, while the cyclically-sensitive AUD, CAD and NOK largely underperformed. Crude oil prices nudged marginally higher on the possibility that OPEC will extend output cuts.
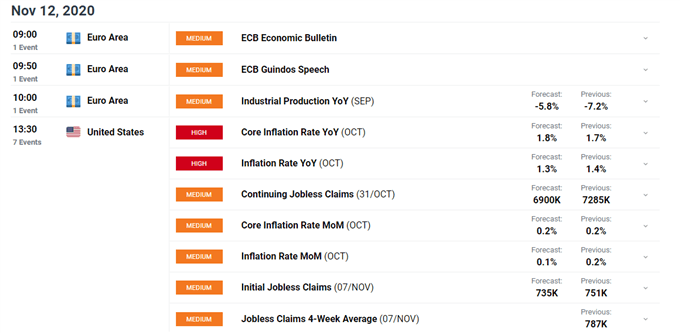
Looking ahead, Euro-area industrial production figures for September and US inflation data for October headline the economic docket.
Tech Stocks Positioned to Outperform
The recent rotation away from the technology sector and into value stocks, on the back of positive vaccine progress, may prove short-lived.
Investors have piled into value stocks in recent days after the vaccine developed by Pfizer and BioNTech proved to be 90% effective in protecting people from the novel coronavirus. This buoyed corporations with more traditional business models and, given the US just registered a record 144,000 new cases of Covid-19, is of course great news.
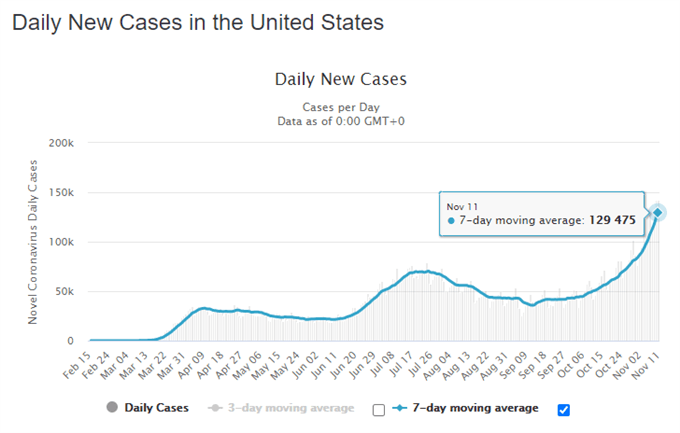
Source - Worldometer
However, with the shots requiring a storage temperature of -70 degrees Celsius and two doses needed to successfully inoculate a subject, there is a distinct possibility that distribution of this vaccine will be limited. This reality may temper the current sectoral rotation and direct capital back into technology stocks.
Moreover, the potential implementation of targeted lockdown measures under a Biden administration could also put a premium on tech companies. The tech-heavy Nasdaq 100 has vastly outperformed its US benchmark counterparts since the March nadir, climbing 88% while the S&P 500 and Dow Jones rose 65% and 64% respectively.
Therefore, the current fundamental backdrop may continue to advantage restriction-resilient technology companies and buoy the Nasdaq 100 index in the medium-term.
Nasdaq 100 Futures Daily Chart – Consolidating in Bull Pennant
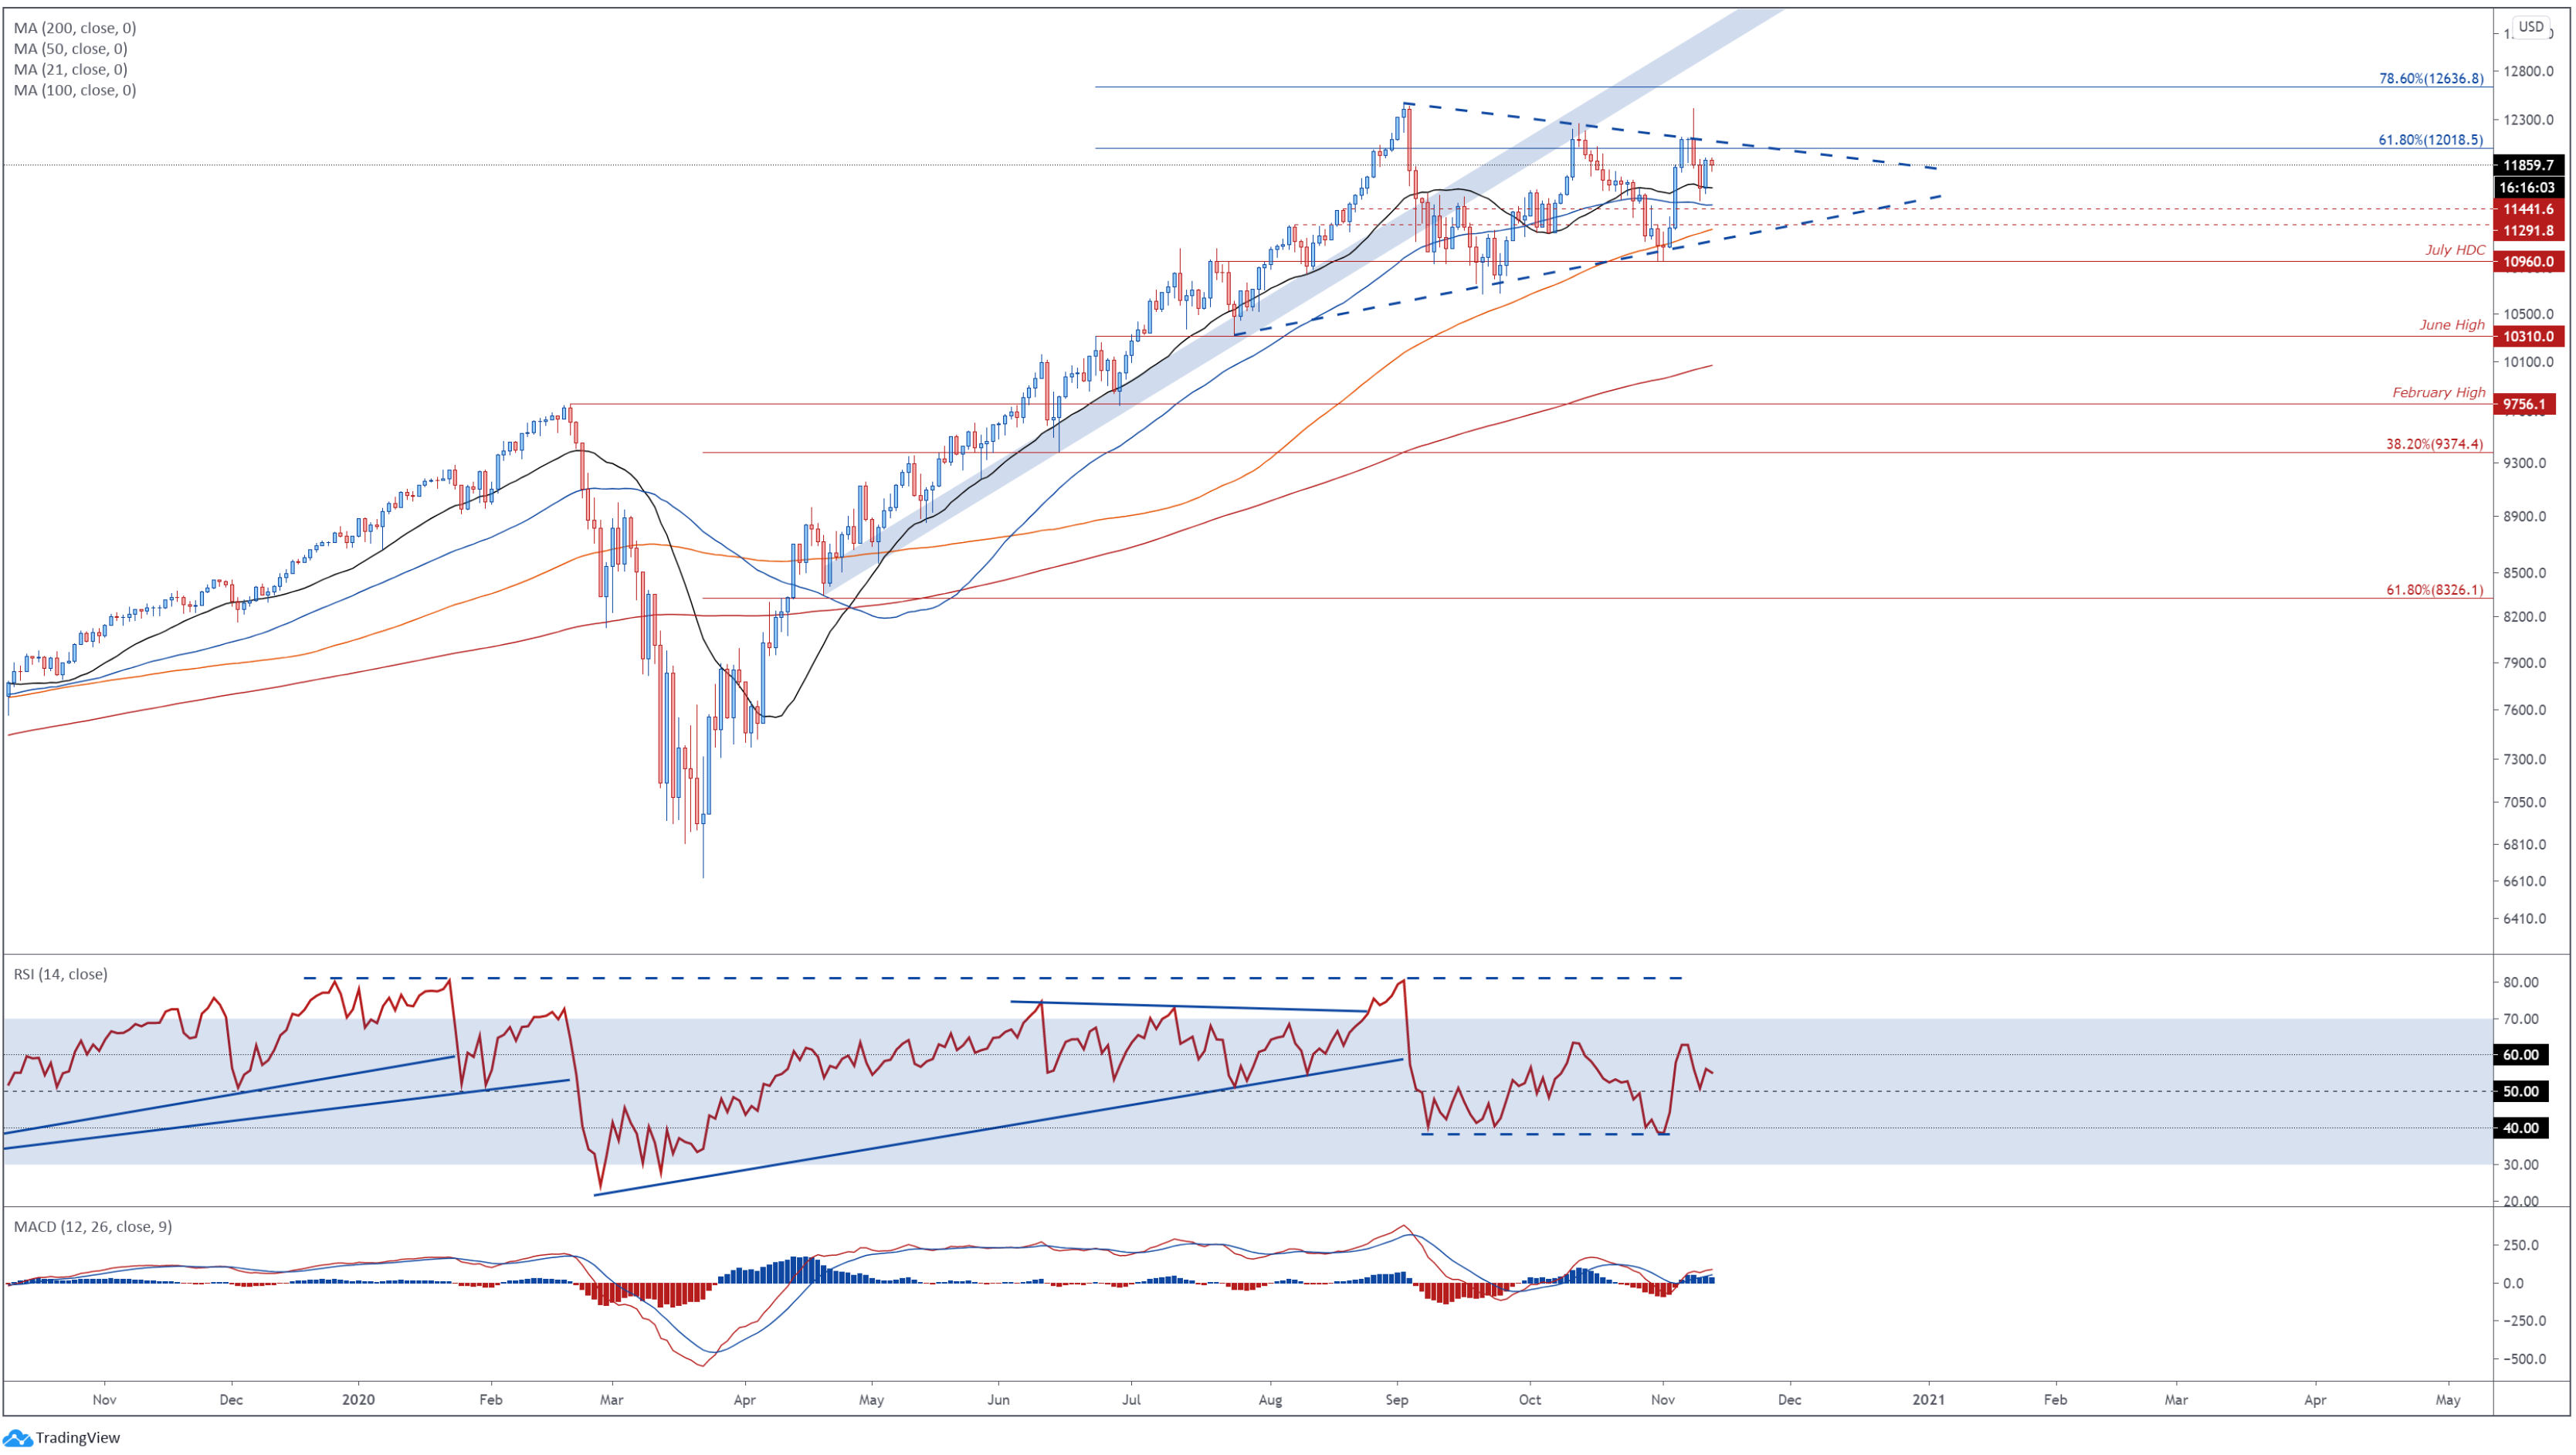
Nasdaq 100 index futures daily chart created using TradingView
The technical outlook for the Nasdaq 100 index remains skewed to the topside, as price carves out a Bull Pennant continuation pattern.
With price perched constructively above all four moving averages and both the RSI and MACD indicator tracking firmly above their respective neutral midpoints, the path of least resistance appears to favour the upside.
A daily close above the October high (12262) may neutralize selling pressure and carve a path to challenge the yearly high (12466) set in September. Pushing through that would probably bring the 78.6% Fibonacci (12637) into play and signal the resumption of the primary uptrend.
Alternatively, breaking through confluent support at the 50-DMA and August 19 high (11441) could open the door for a challenge of pennant support and the 100-DMA (11252).
Nasdaq 100 Futures 4-Hour Chart - Holding Above Key Support
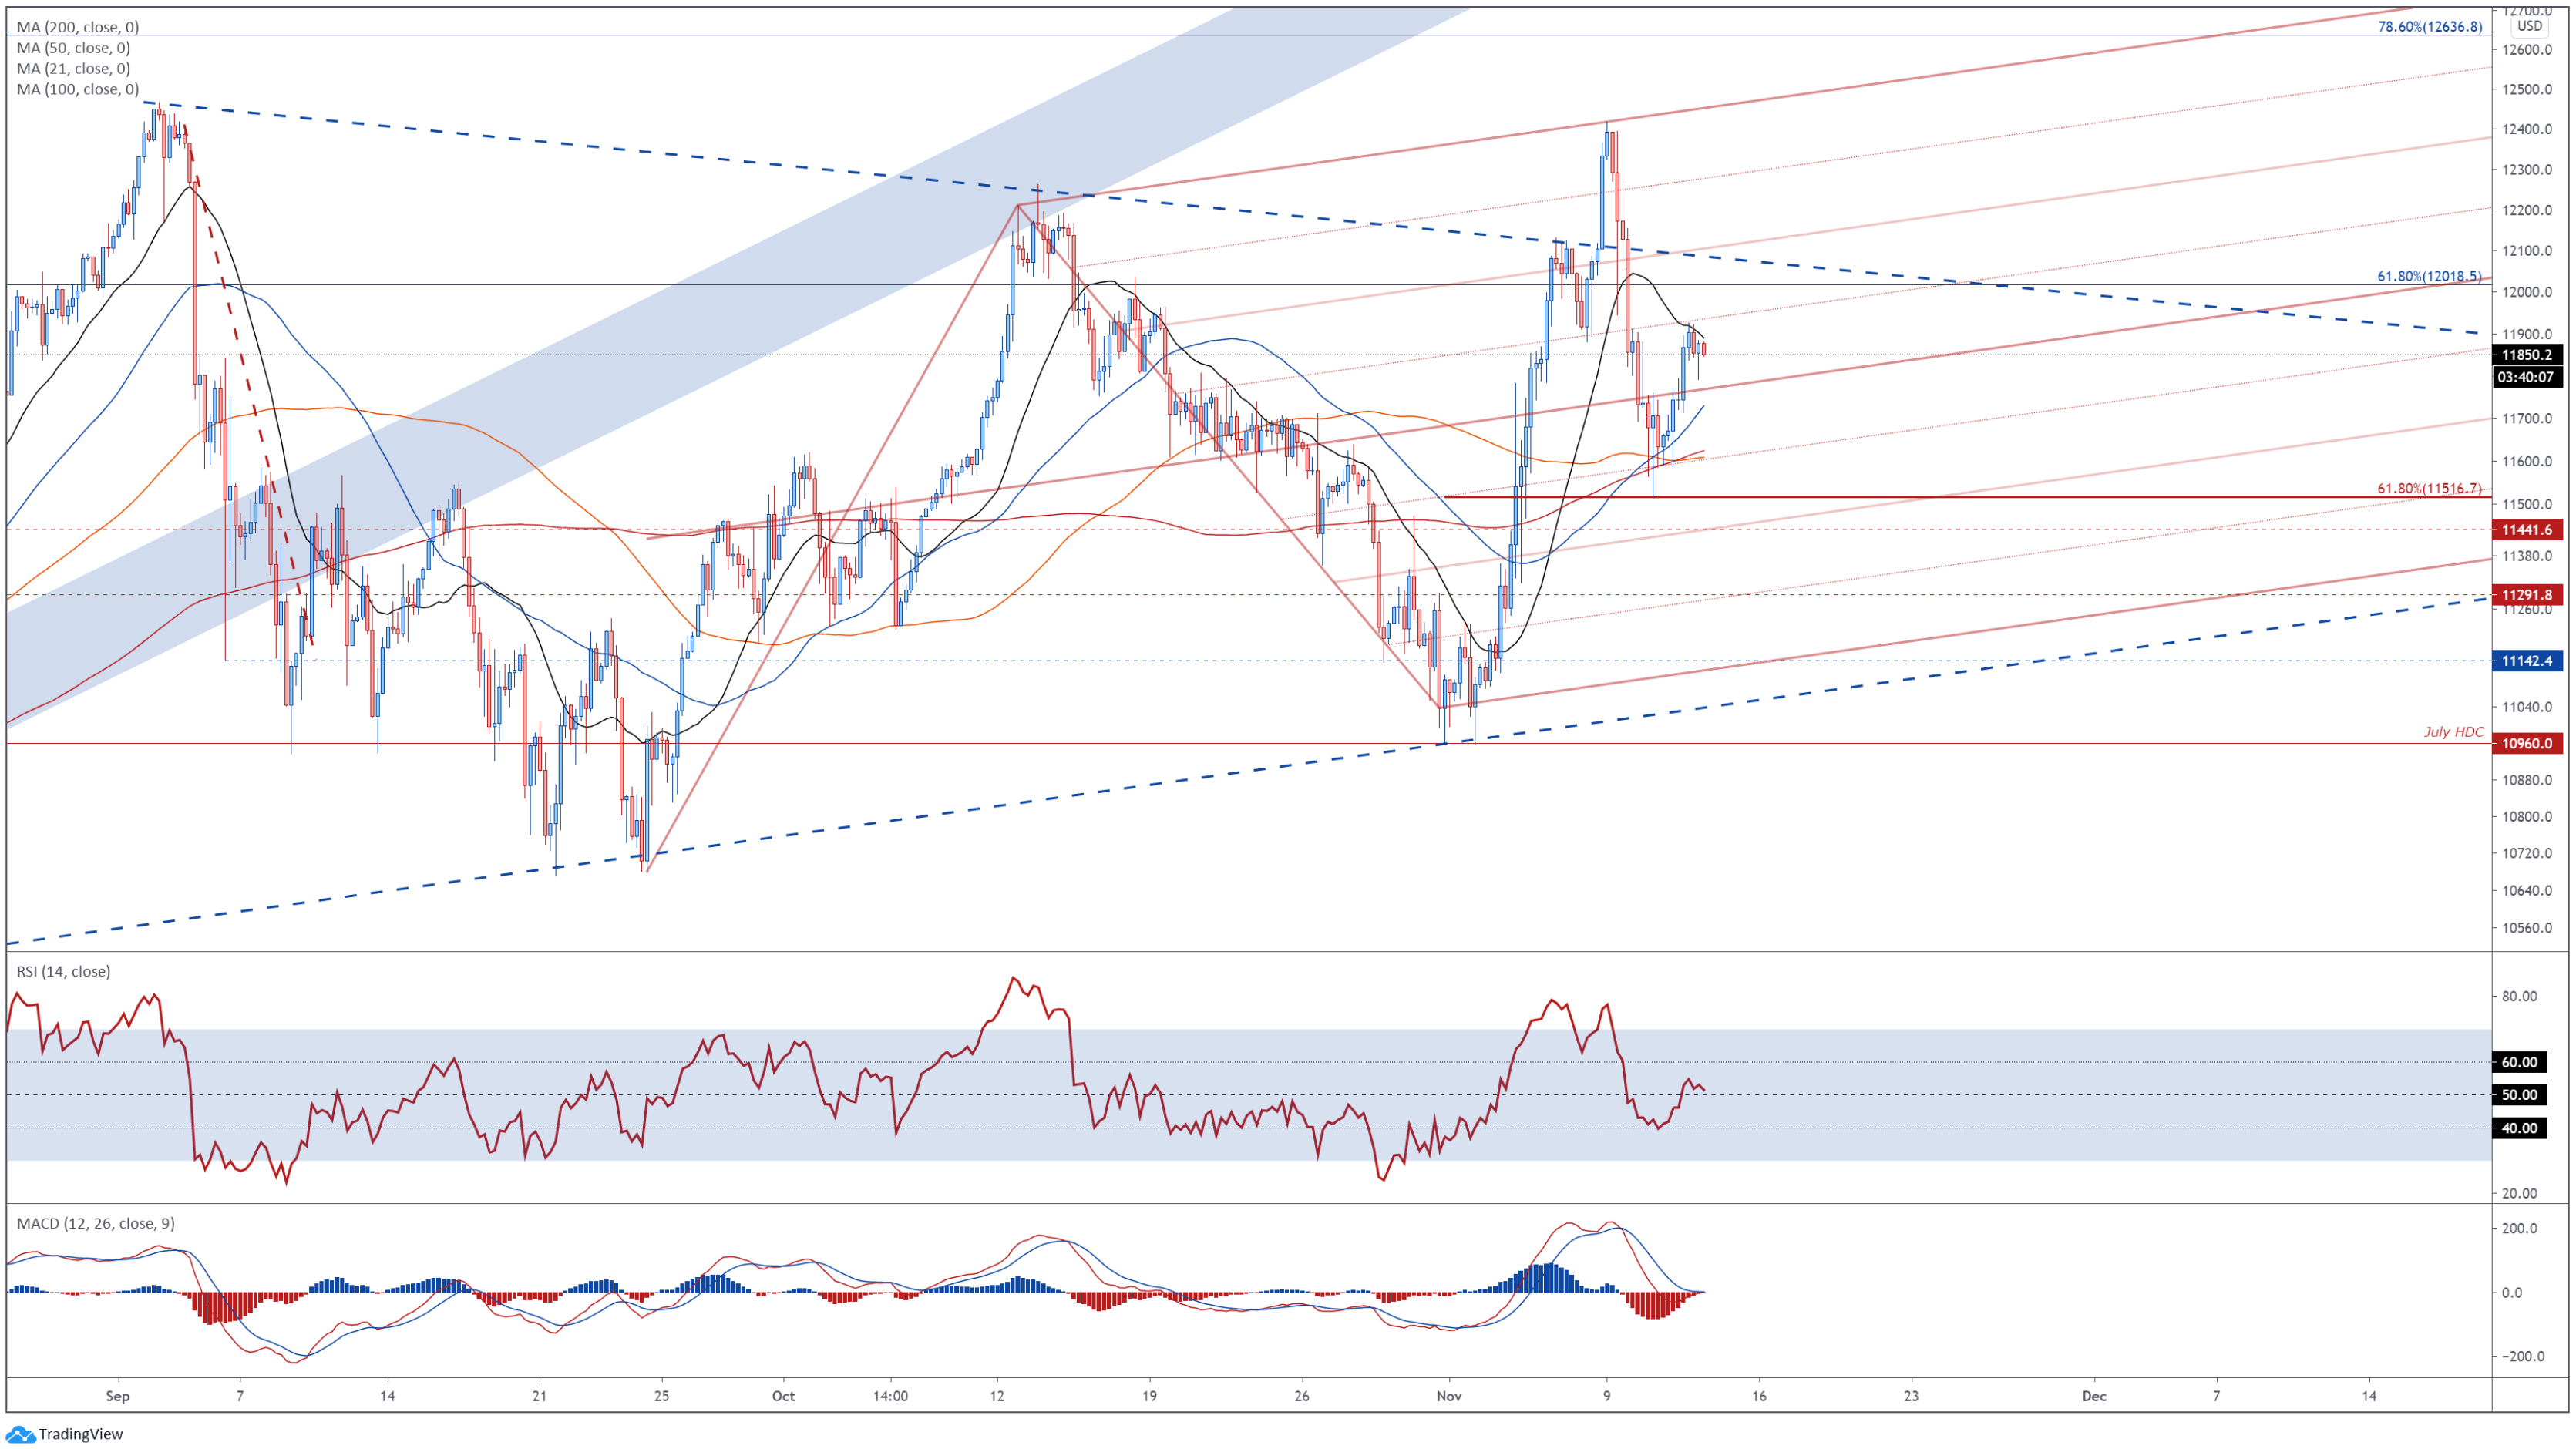
Nasdaq 100 futures 4-hour chart created using TradingView
Zooming into the daily chart bolsters the bullish outlook depicted on the monthly timeframe. Prices attempted to break higher after clearing pennant resistance however, the move was cut short by Schiff Pitchfork resistance and psychological resistance at 12400.
This ignited an aggressive short-term correction towards the sentiment-defining 200-MA (11624). Tellingly, prices held above the 61.8% Fibonacci (11516), suggesting that a continued topside push is on the cards.
A burst above the 21-MA (11891) may invite follow-through and clear a path towards 12000. Hurdling that brings the November 9 high (12418) back into focus.
Conversely, falling through the support range at 11750 – 11800 could precipitate a pullback towards the 100-MA (11609).
-- Written by Daniel Moss, Analyst for DailyFX
Follow me on Twitter @DanielGMoss