

Macro, USD, Gold, Oil Talking Points:
- The highlights on this week’s economic calendar look to be an RBNZ rate decision tomorrow afternoon, followed by US data on Wednesday and Thursday (Durable Goods, PCE); and Friday closes the week with Germany inflation. (Learn how to read and use the economic calendar)
- While new coronavirus cases continue to rise both in the US and globally, the risk on trade has thus far held support, even after US stocks began to shake earlier in the month of June.
- The US Dollar has built into a rising wedge formation following a test of support at a key area on the chart two weeks ago, and this goes along with potential bullish breakout setups in both gold and oil.
Equities Weigh Next Directional Push
The past two weeks have seen questions arise as to whether the risk-on rally has legs for further gains, and to call this a dicey backdrop could be an understatement. After a massive re-pricing in the month of March, risk has been on in a very big way as a potent combination of stimulus and positive news around coronavirus numbers furnished a backdrop in which many were looking for a ‘V-shaped recovery.’ But as evidence mounts that this may not be the case, bulls and bears are caught in the middle as they look to push that next directional move for global stocks.
At the center of this recent shuffling was the FOMC rate decision earlier this month. While the bank has been very active with stimulus programs already, Chair Powell didn’t seem to share the same optimism as equity bulls, instead opining that many people coming back into the labor market may not have jobs to come back to. Prices quickly turned and that slump held into last week’s open, after which a strong showing on Monday and Tuesday led into a lower-high that held through the rest of the week.
As looked at last Monday, that pullback in the S&P 500 found support at a confluent spot on the chart before staging a strong push in the early-portion of last week. This led to a bounce to a resistance area of interest plotted around the 3169 level, which is the 14.4% Fibonacci retracement of the 2016-2020 major move. Much of the price action since has been taken the form of consolidation.
S&P 500 Four-Hour Price Chart
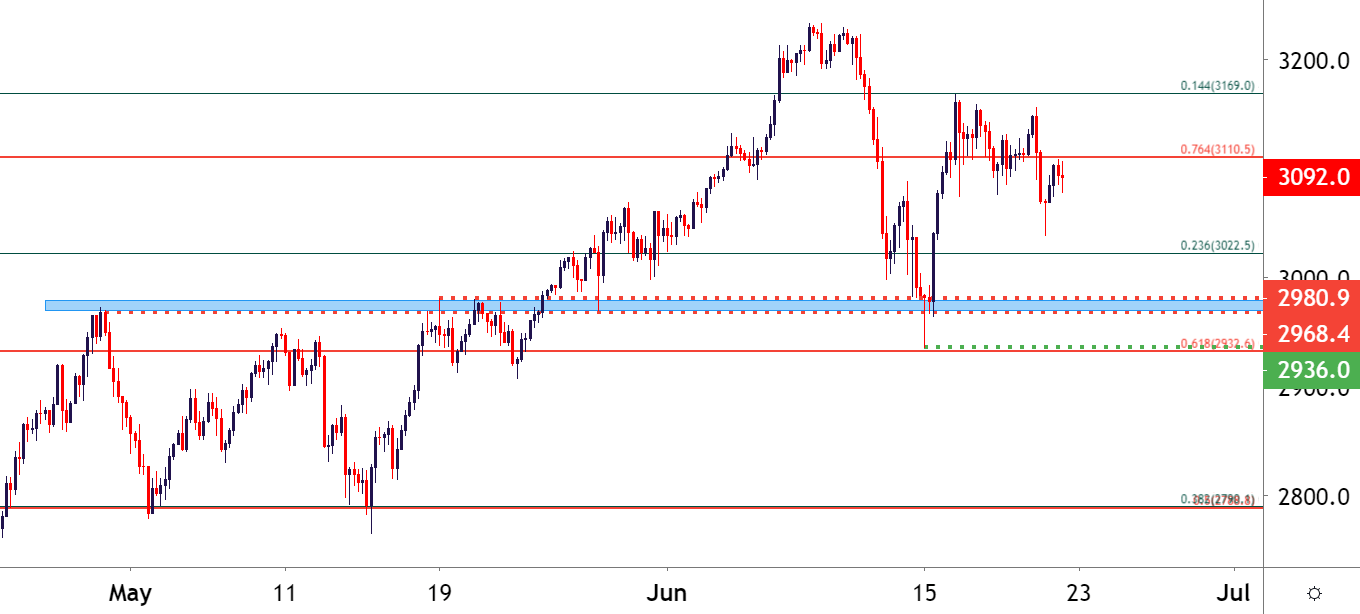
Chart prepared by James Stanley; SPX500 on Tradingview
US Dollar Builds Rising Wedge – Will Sellers Attack?
Going along with that pump in US equity prices through late-May and early-June was a fall in the US Dollar. The currency broke out of a near two-month-range as sellers pushed prices down to fresh lows, and given the extreme accommodation from the FOMC and the prospect of even more accommodation down-the-road, this relationship and that move in the USD made sense.
But as of a couple weeks ago the US Dollar began to test a big spot of support on the chart. There was perhaps a bit of capitulation around the FOMC event a couple of weeks ago as USD-bears pushed down to a fresh low, only to be thwarted soon after by bulls responding to support with a strong topside push.
Since then – the US Dollar has been in the midst of a bullish short-term trend, although with some context, even that bullish backdrop could be construed in a bearish manner from longer-term charts, as looked at a little lower in this article.
US Dollar Hourly Price Chart
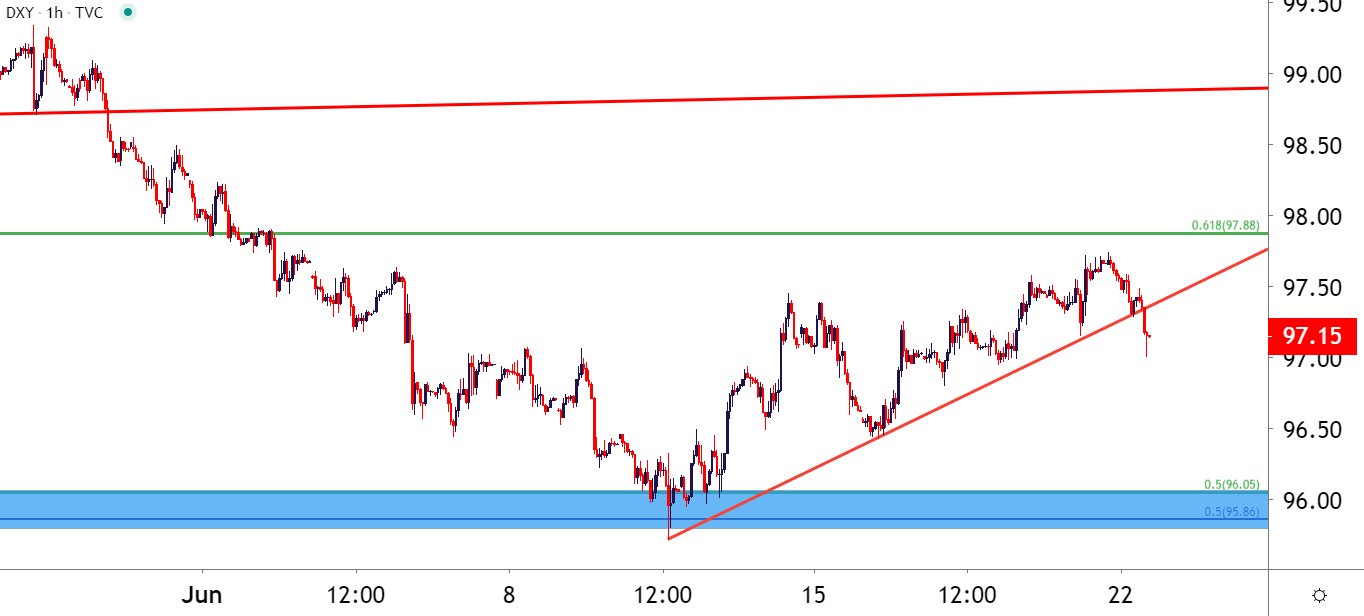
Chart prepared by James Stanley; USD, DXY on Tradingview
Taking a step back to get some context, and this week-and-a-half bounce appears to be corrective in nature after that support test; and price action since that test has taken on the form of a rising wedge.
Rising wedge formations will often be approached with the aim of bearish reversals, taken from the logic that bulls showing trepidation at-or-around highs, much more so than what’s seen around support, could eventually entail a change in trend. In this instance, that rising wedge also takes on the form of a similar formation in a bear flag, which is also corrective after a big level of support comes into play that thwarts sellers’ offers, at least temporarily, as a counter-trend, shorter-term theme begins to build.
US Dollar Four-Hour Price Chart
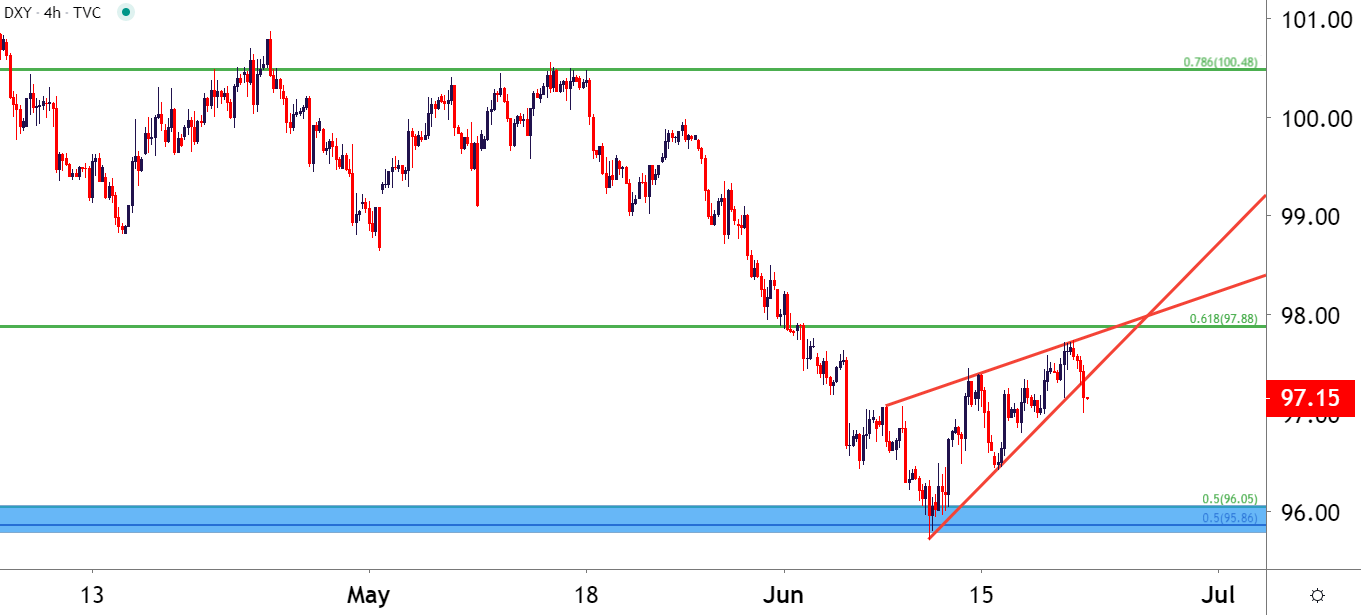
Chart prepared by James Stanley; USD, DXY on Tradingview
Gold Threatens Fresh Seven-Year-High
Gold is starting the week in a testy manner, pushing above the big spot of Fibonacci resistance that’s helped to keep the advance at bay over the past couple of months. This level plots at 1742.50 and is the 14.4% Fibonacci retracement of the post-Financial Collapse move in gold. This week’s open was marked by a quick break above that price, followed by a pullback at which point that prior resistance quickly became support.
Price action has since surged and the seven-year-high is now very nearby. The big question is for how long might bulls be able to drive? And further – will USD bears chip in, as the above setup in the USD may provide some motivation for Gold bulls to continue pushing.
Gold Four-Hour Price Chart

Chart prepared by James Stanley; Gold on Tradingview
Oil Brewing for Breakout
Another major commodity market appears to be on the cusp of a bullish breakout, and I had looked at this one in our weekly forecasts. Oil prices have built in an inverse head-and-shoulders pattern, with the neckline demarcated around the $40-handle. Such a formation can make sense, while also keeping the door open for further topside potential, as a big level coming into play, such as the $40-handle, may take multiple pushed from bulls before it can be left behind. This is what helps to create the shoulders and head of the formation, with the neckline plotted around that key point of resistance that’s so far held bulls at bay.
WTI Crude Oil Four-Hour Price Chart

Chart prepared by James Stanley; Oil on Tradingview
This is a far cry from the negative $40 that current month oil contracts traded at just a couple of months ago, but perhaps more importantly to current analysis – that $40 level has been getting tested for a large portion of June already. It first came back into play in the opening days of the month and then came back into the equation last week. Buyers have continued to persist – and the increasing frequency of tests at that price combined with the corresponding higher-lows on short-term charts point to bullish breakout potential in the days or weeks ahead. This is discussed from the fundamental point-of-view by my colleague Christopher Vecchio in his fundamental forecast for Oil for this week.
WTI Crude Oil Hourly Price Chart

Chart prepared by James Stanley; Oil on Tradingview
--- Written by James Stanley, Strategist for DailyFX.com
Contact and follow James on Twitter: @JStanleyFX