

Gold Price Analysis
- Gold prices have bounced back into a key Fibonacci resistance level.
- Since setting a fresh seven-year-high in May, Gold prices have shown back-and-forth price action with little discernible long-term bias.
Gold Prices Return to Fibonacci Resistance
It’s been just about 24 hours since the Federal Reserve announced their most recent rate decision and already markets have begun to show fear. While the Fed did continue to highlight the expectation for continued low rates, FOMC Chair Jerome Powell didn’t sound too upbeat about forward-looking economic conditions, particularly on employment. And given how far this risk-on rally has ran and how quickly it’s happened, it make sense that we see some element of caution showing the day after the head of the FOMC didn’t broadcast an upbeat tone on what they’re seeing on the horizon.
Of specific pertinence to those rallies, Chair Powell was asked of his opinion on the repercussion of the Fed’s recent actions, with an allusion to whether a bubble might be forming as equity markets in the United States rushed right back to their highs, even as the coronavirus continues to spread and certain states are in the midst of data spikes for both new infections and hospitalizations. Chair Powell firmly pointed out that the bank’s dual mandate has thus far been served by their actions; but at no point were those actions taken with equity markets in mind.
This is pertinent to Gold as the yellow metal has been well-bid over the past year-and-a-half, right along with the Fed shifting into a more-dovish stance. The story really started at the tail-end of the FOMC’s hiking cycle, around the open of Q4 in 2018. In the opening days of the quarter, Jerome Powell was asked directly about the neutral rate; with market participants expecting the head of the Fed to say that one or two rate hikes may get the bank closer to this ‘goldilocks’ destination. But that’s not what he said – he instead said that he felt the neutral rate was ‘a long way off,’ giving rise to the idea that the Fed had plans to continue hiking through 2019 and beyond.
Markets didn’t like this one bit. In short order, equities folded and continued to sell-off into the Christmas holiday, and Gold prices perked up under the apparent drive that the Fed would, eventually, have to shift into a more-dovish position. .
Gold Weekly Price Chart
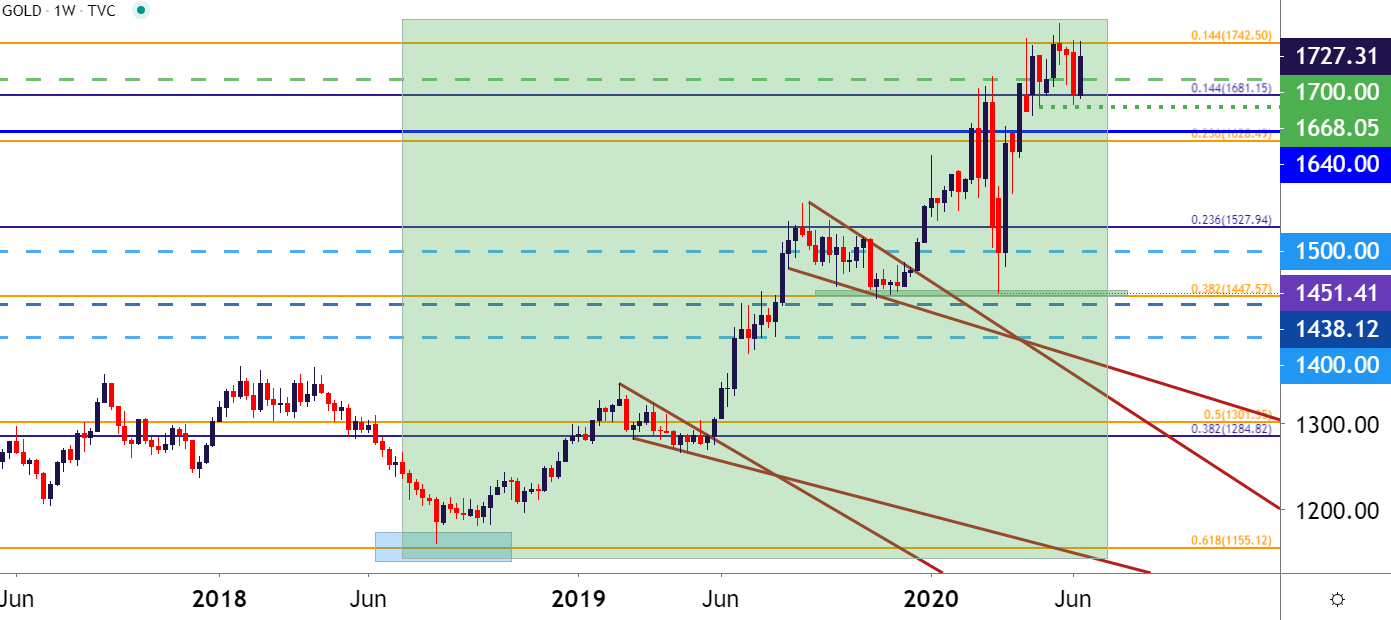
Chart prepared by James Stanley; Gold on Tradingview
The summer of last year was especially climactic – this is when the rubber met the road as the Fed actually began laying the groundwork for the first of last year’s three rate cuts. As this happened Gold prices perked-up with a bullish breakout, and that topside move continued into September; at which point price action began to digest and that digestion took on the form of a falling wedge formation ahead of a December breakout.
Gold Daily Price Chart
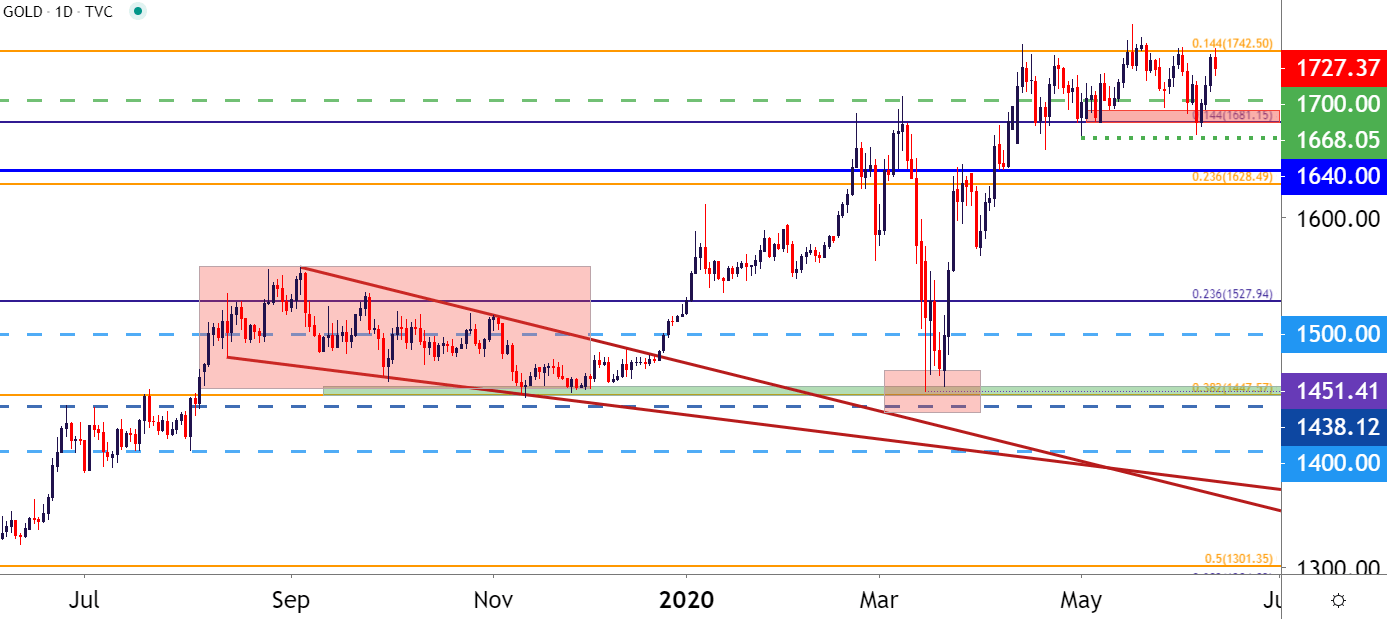
Chart prepared by James Stanley; Gold on Tradingview
Welcome to Chaos (or 2020)
The year of 2020 has already been one for the books and we’re not even half-way through. Punctuating the horizon is what looks to be a contentious Presidential election in the US; and along the way is the potential for considerable social strife to go along with a still-raging global pandemic.
When this news began to get priced-in during March trade, Gold prices tanked, losing almost 15% of its value in less than two weeks. But – that same support that helped to hold the lows in December of last year soon came back into play, and buyers then reacted with a robust topside move that saw Gold prices gain as much as 20%. But after setting a fresh seven-year-high in mid-May, price action in Gold has been churning in either direction without a discernible long-term bias. There was an item of near-term support showing on Monday, and that’s led into another bounce into Fibonacci resistance around the 1742.50 area on the chart. But so far that move has stalled, giving rise to the potential for continued digestion as the world waits to see what’s around-the-next-corner.
Gold Price Four Hour Chart

Chart prepared by James Stanley; Gold on Tradingview
--- Written by James Stanley, Strategist for DailyFX.com
Contact and follow James on Twitter: @JStanleyFX