

Gold Price Forecast Talking Points:
- For nine years the 1920 level loomed large for Gold prices, as this was the prior all-time-high set in 2011.
- In late-July, an aggressive bullish trend in Gold prices took out that level on the way to a fresh all-time-high at 2075.
- After a two-month round of digestion, Gold bulls are back, threatening to push a bullish breakout from a falling wedge formation.
- The analysis contained in article relies on price action and chart formations. To learn more about price action or chart patterns, check out our DailyFX Education section.
Gold Prices Threaten Bullish Breakout
It’s now been a couple of months that the bullish trend in Gold has been on pause; and this comes after an aggressive topside trend had taken-over this summer. After digesting over a two-month pattern from mid-April into mid-June, bulls took over to build a rally that drove for much of the next two months.
In late-July, Gold prices finally set a fresh all-time-high, taking out the 1920 level that loomed large for more than nine years after initially being set in September of 2011. But when that price was encountered by the recent advance in late-July, it could barely pause the move as buyers continued to push the bid. This eventually allowed for a break-through the psychological 2,000 level until, eventually a fresh all-time-high was set on August 7th. But that same day showed the build of a bearish engulfing candlestick which will often be followed with the aim of bearish continuation; and that led to a strong pullback in early-August that saw as much as $200 taken-out.
In the months since, it’s been a steady struggle between bulls and bears as price action has formed a falling wedge formation, which will often be approached with the aim of bullish reversals. In this case, that would be in the direction of the original trend and as looked at in last week’s webinar, this falling wedge even had similar tones to a bull flag formation, with prices pulling back before setting stage for a continuation of the original trend.
Gold Weekly Price Chart
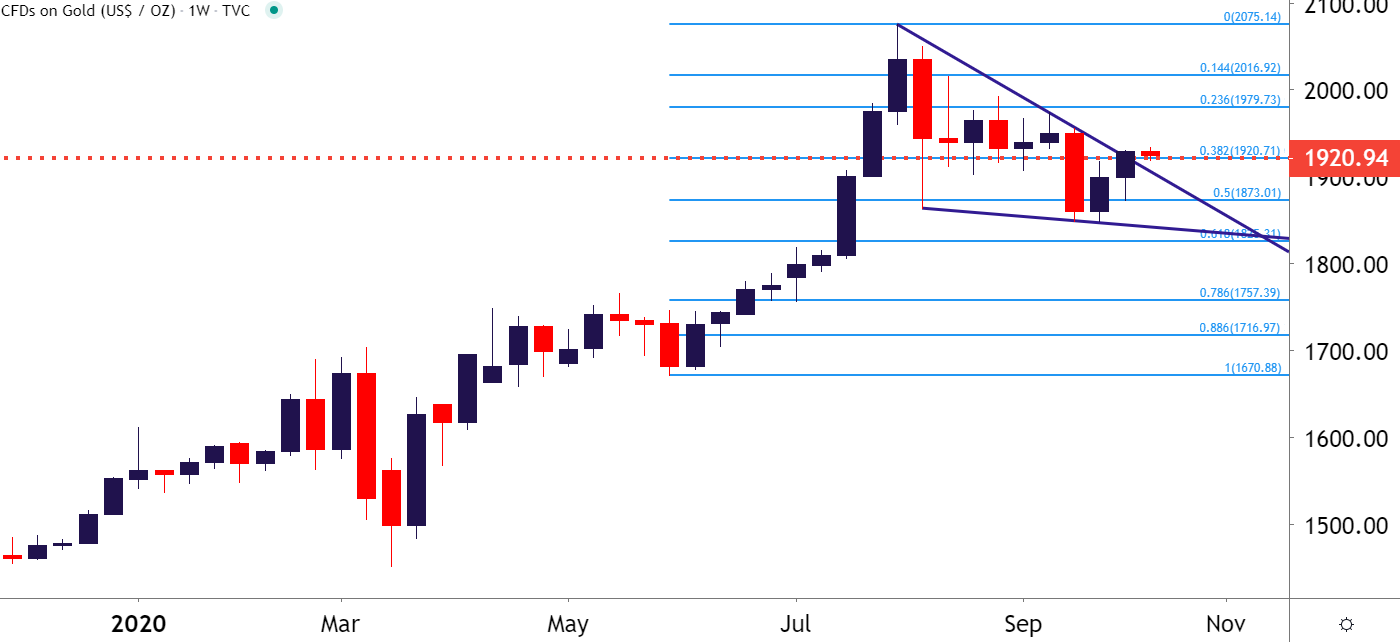
Chart prepared by James Stanley; Gold on Tradingview
This isn’t the first time such a formation has presented itself in this bullish Gold theme. Similar instances showed up from August-December of last year, as well as February through May. In each case, these prolonged build of digestion formations were merely pause points in the bigger picture trend; and given the current backdrop, this recent build into a falling wedge may be presenting a similar situation.
Gold Weekly Price Chart
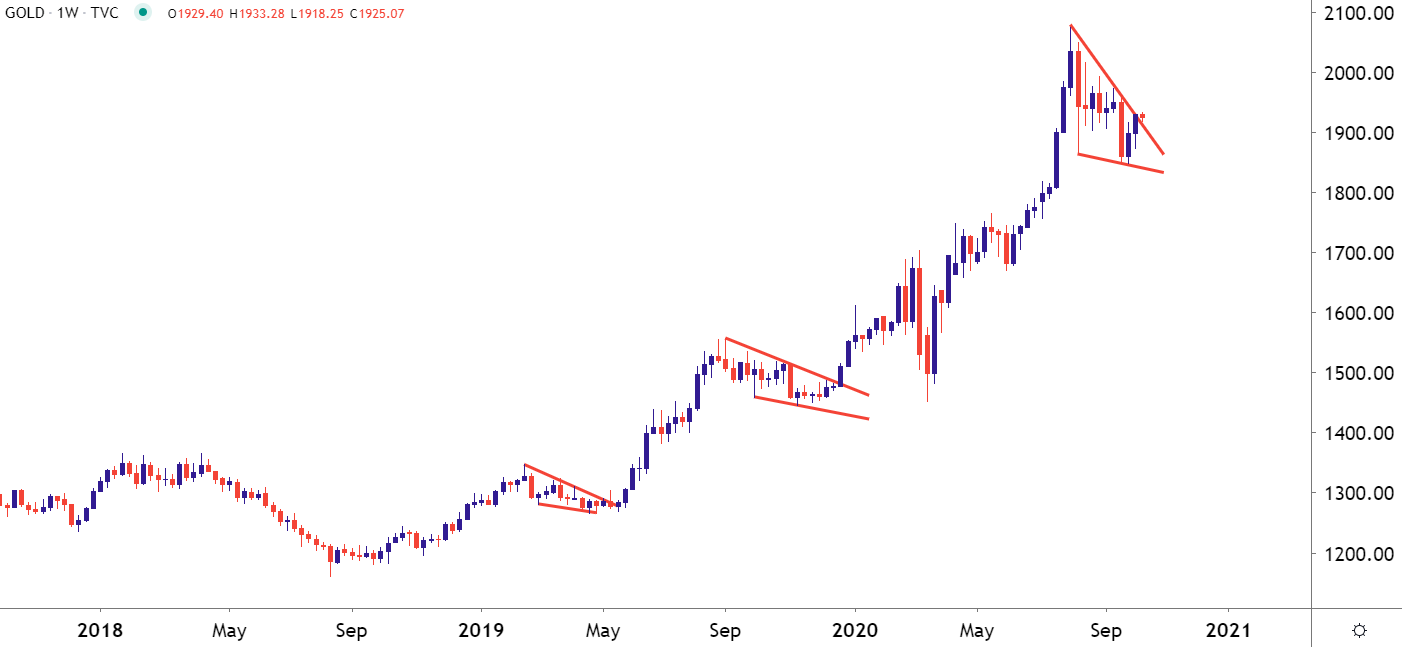
Chart prepared by James Stanley; Gold on Tradingview
Taking a shorter-term look at the matter and Gold price action is starting the week with some optimism. Gold prices are trading above that 1920 level that was previously held as the all-time-high. This level is also confluent with the resistance side of that falling wedge, highlighting the potential for continuation as prices are attempting to set support at an area of prior resistance.
Gold Daily Price Chart
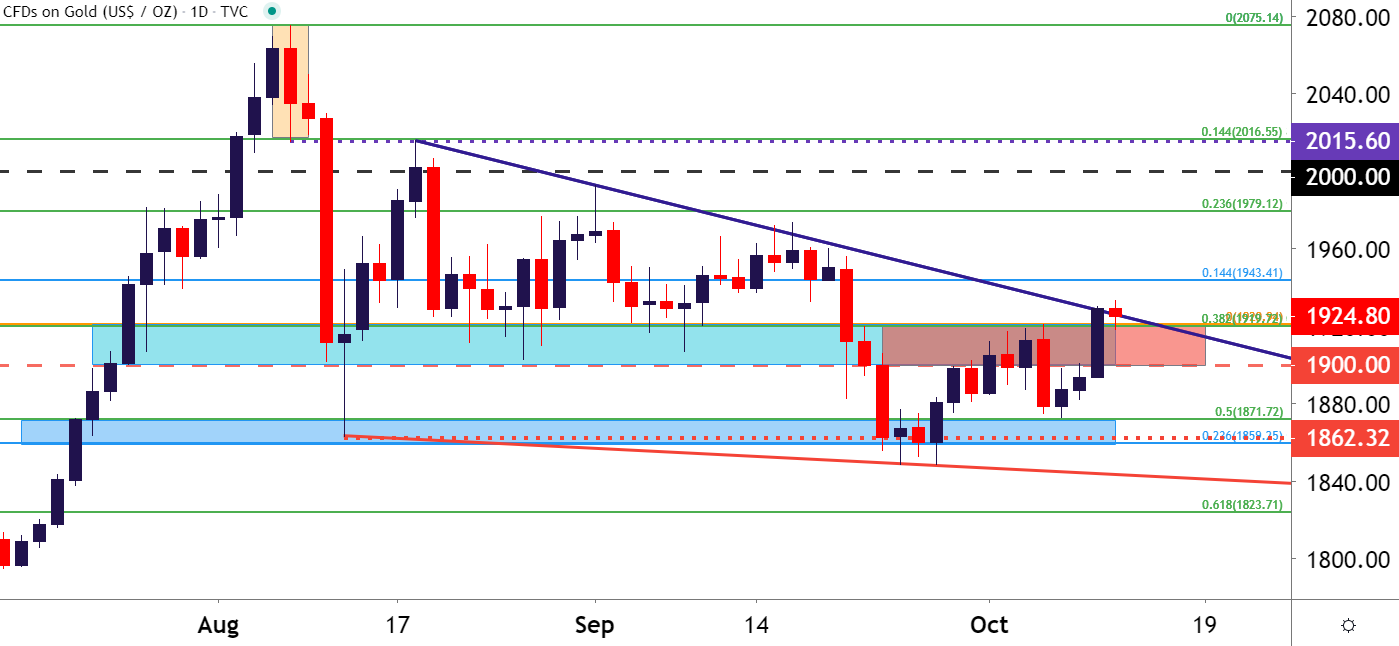
Chart prepared by James Stanley; Gold on Tradingview
Busy Week of Data, Earnings, Headlines Keeps Pressure on the Bid
The big data items on the economic calendar for this week are retail sales and US inflation numbers, the latter of which is set to be released tomorrow morning. But, perhaps even more important to the scope of the US Dollar and related themes, of which Gold is one, is the prospect of another stimulus package. And given current political dynamics in D.C., it’s unlikely that a stimulus package will be forgotten about so close to the upcoming election. Also of consideration – we’re nearing earnings season in the US and this can certainly have some macroeconomic impact, as well; so while there’s a series of possible drivers, the current backdrop appears to be at least somewhat accommodative for the bullish backdrop in Gold prices.
The next big levels on the Gold chart look to be around 1943, 1960 and then around 1973. On the support side of the matter, the 1900 level sits just underneath recent lows, after which 1871, 1860 and then 1950 come into play.
Gold Four-Hour Price Chart
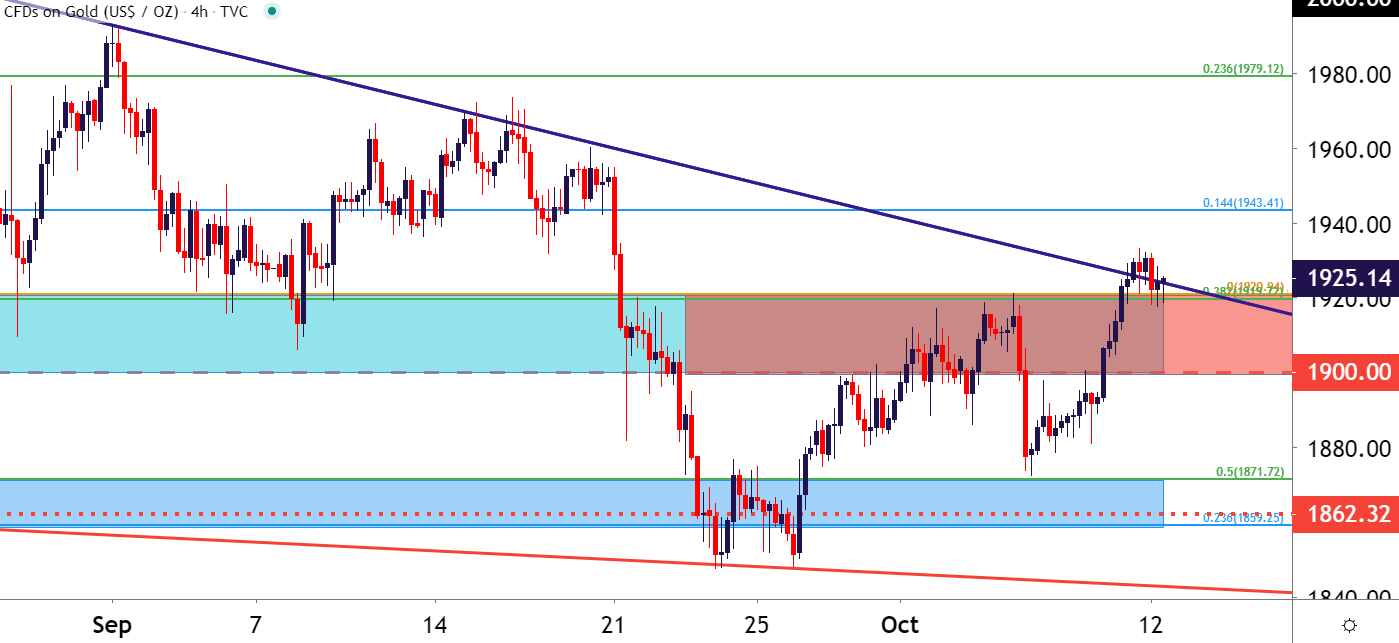
Chart prepared by James Stanley; Gold on Tradingview
--- Written by James Stanley, Strategist for DailyFX.com
Contact and follow James on Twitter: @JStanleyFX