

Gold Talking Points:
- Gold prices have pulled back ahead of the June FOMC rate decision.
- Gold prices are sitting on a big spot of support and that’s been in-play through the first half of this week.
- The analysis contained in article relies on price action and chart formations. To learn more about price action or chart patterns, check out our DailyFX Education section.
Today at 2pm brings the June FOMC rate decision and the wide expectation appears to be for the bank to punt on pretty much every item that they can. There may be a slight moderation in rate forecasts, with a potential 2023 hike highlighted in the dot plot matrix versus the prior expectation for that first hike to be in 2024. But, outside of that and given the moves seen in risk markets after last week’s inflation print, it would appear that most market participants are expecting QE to remain in full effect with no signaling towards the contrary.
In Gold, prices remained pinned down to support following last month’s break of the bull flag formation. That bull flag took nearly nine months to build following last year’s flare, largely driven by the heavy-handed actions of the FOMC’s stimulus outlays.
To learn more about bull flag formations, check out DailyFX Education
Gold Weekly Price Chart
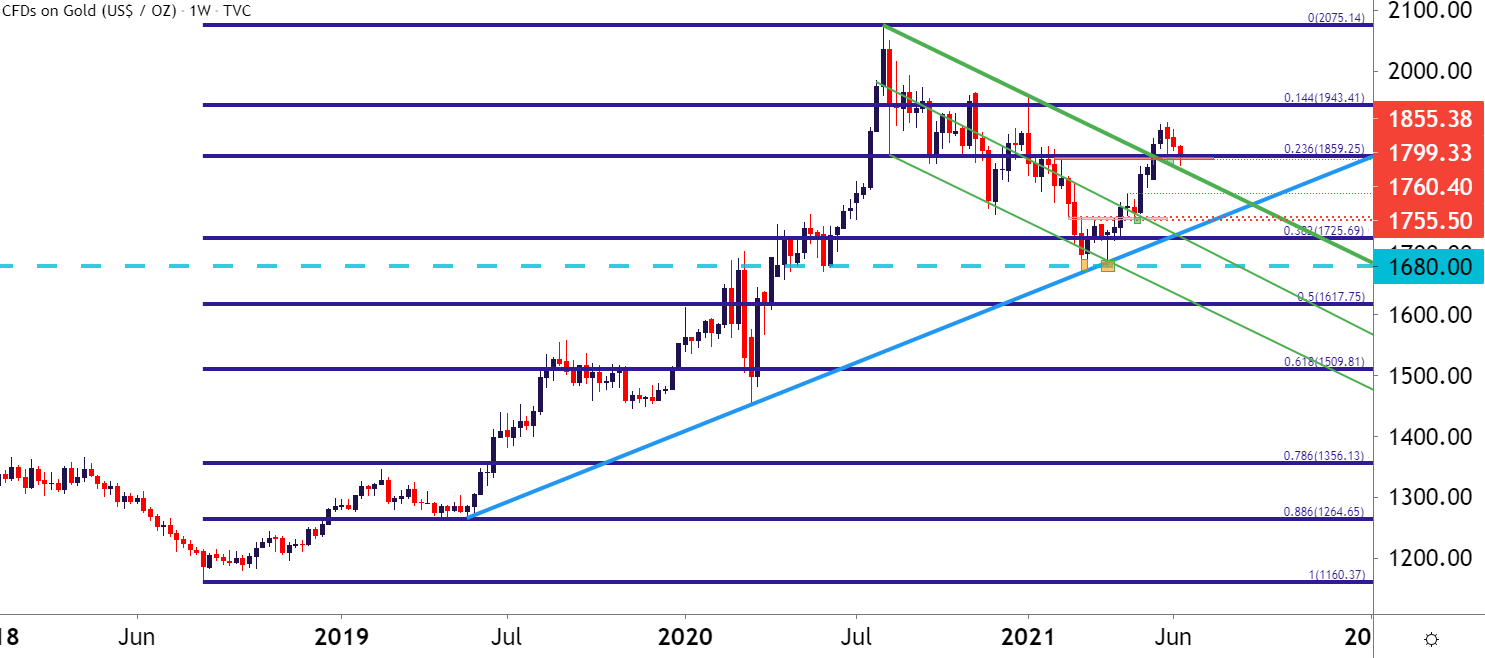
Chart prepared by James Stanley; Gold on Tradingview
On the above chart, you’ll probably notice that prices are currently testing the 23.6% Fibonacci retracement of the 2018-2020 major move. This plots at 1859.25 and for the past month, this has been a key level for Gold prices.
When bulls were pushing the breakout from the bull flag, the resistance side of that formation was confluent with this price. And a few weeks later, it came back as support but buyers were unable to take out the high, instead, getting caught at resistance around the 1900 psychological level.
Since then prices have reverted right back down to this support and this zone has now held the lows through the first 2.5 days of this week, leading into FOMC.
To learn more about psychological levels, check out DailyFX Education
Gold Daily Price Chart
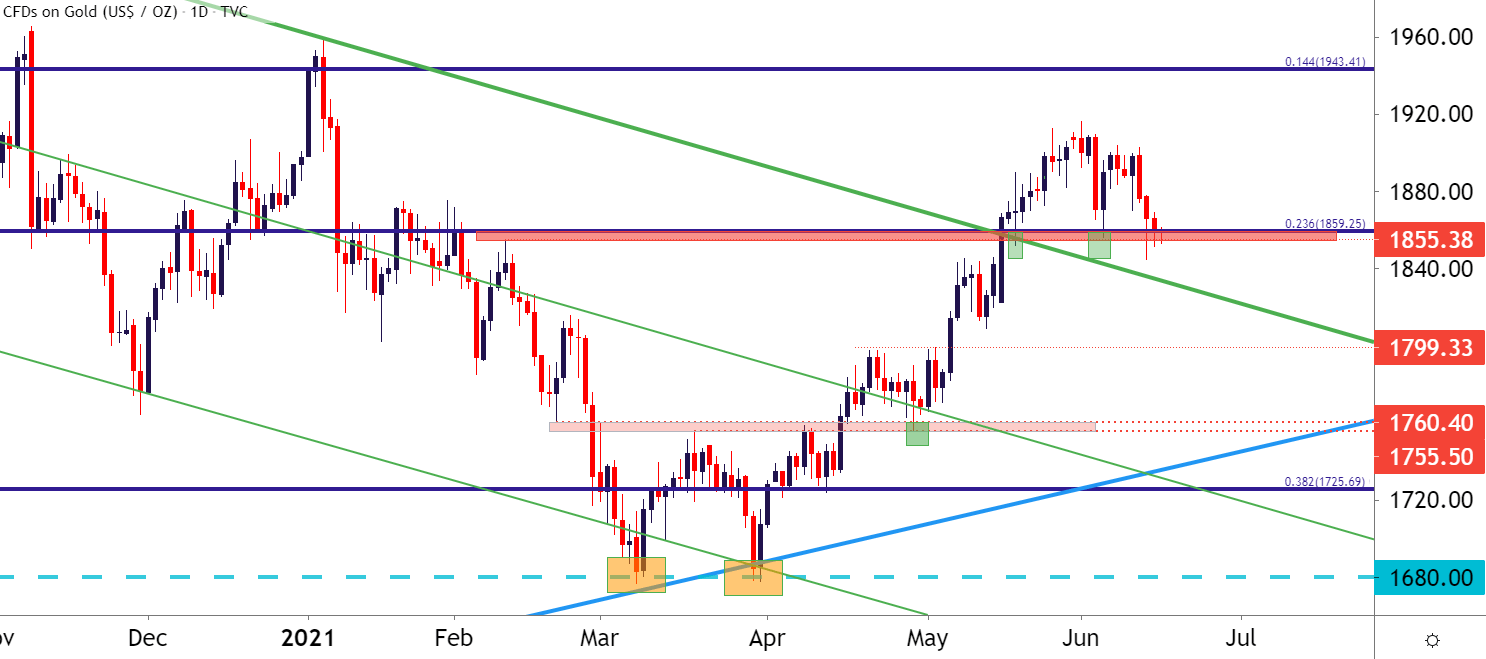
Chart prepared by James Stanley; Gold on Tradingview
Gold Levels Ahead of FOMC
Adding a Fibonacci retracement to the recent major move spanning from the April 29 swing low up to the May high, and the 38.2% retracement lines up very closely to the longer-term retracement looked at above. This level is at 1855.18 and together with 1859.25, creates a confluent support zone that’s currently holding price.
Below this, the 1836 level sticks out as it’s the 50% marker from the shorter-term move. If Gold bulls are unable to hold support at this level, the bigger picture bullish trend may come into question.
Above current prices, there’s a short-term spot of resistance around 1870, after which 1878 comes into play as the 23.6% retracement of the shorter-term move. The next level after that is at 1893, after which the 1900 psychological level comes back into play.
Gold Four Hour Price Chart
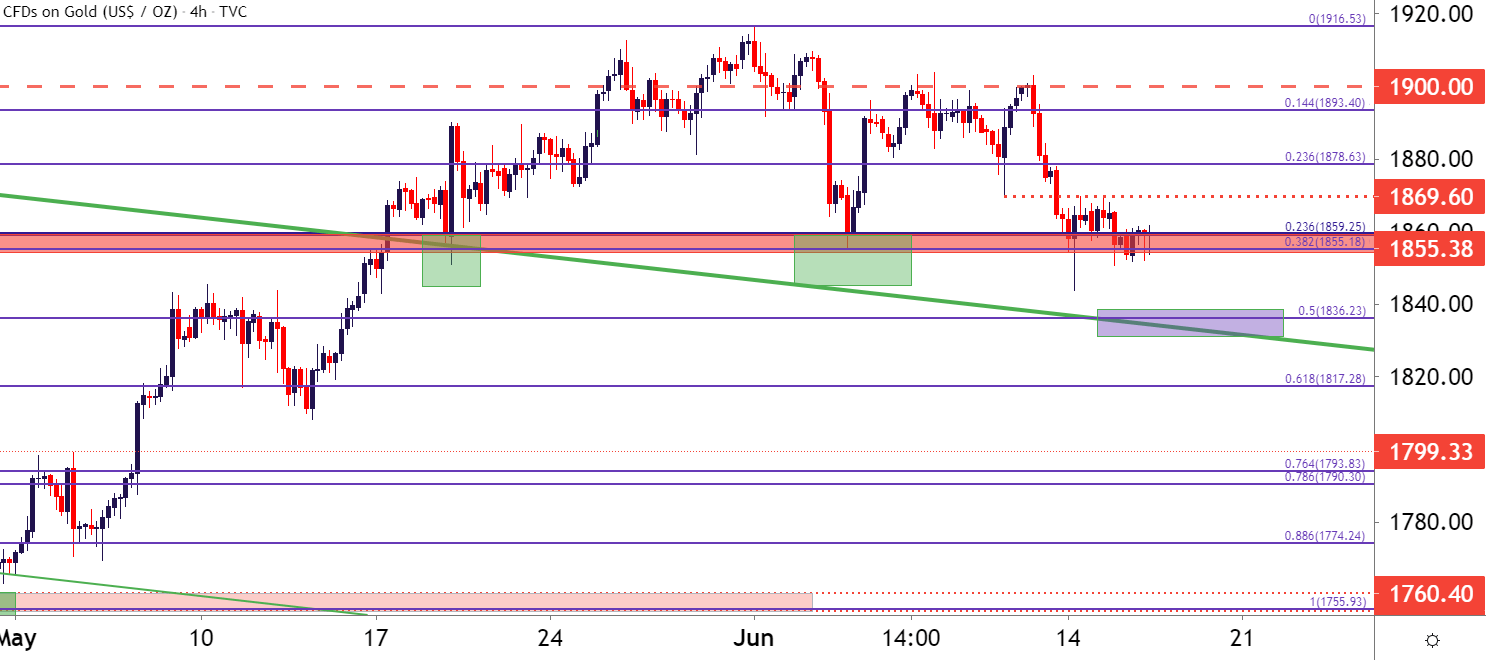
Chart prepared by James Stanley; Gold on Tradingview
--- Written by James Stanley, Senior Strategist for DailyFX.com
Contact and follow James on Twitter: @JStanleyFX