

Gold Talking Points:
- After a strong bullish run from October of 2018 through August of 2020, Gold prices remain a state of limbo after a 38.2% pullback of the recent major move.
- The Fed has been clear that they’re not anticipating tighter policy through 2023 but rates markets don’t seem so convinced and of recent, that’s seemed to have a negative impact on Gold prices.
- The analysis contained in article relies on price action and chart formations. To learn more about price action or chart patterns, check out our DailyFX Education section.
Gold prices remain in flux and yesterday’s FOMC rate decision seems to have done little to help matters. While the Fed continues to transmit a loose and passive approach, they’ve so far been unable to quell fear from market participants that rising inflation will eventually force the bank’s hand into faster rate hikes than what’s currently being anticipated. At this point, the Fed is saying that they’re not expecting any hikes through 2023, which would mean the problem of tightening policy would fall with Mr. Powell’s successor, as his term ends in February of 2022.
But, given the situation in Gold, I wanted to present this scenario in an orderly format, first starting with the longer-term or bigger-picture and then drilling down to the shorter-term setup.
Gold Prices Big Picture – The Bullish Cycle Sees a Pullback
Gold prices began another bullish cycle in Q4 of 2018. This was on the back of an off-hand comment from FOMC Chair Jerome Powell when he was asked about his opinion about the bank’s proximity to the ‘neutral rate.’ The neutral rate is that theoretical goldilocks rate that’s neither stimulative nor restrictive and, at the time, the Fed had already hiked multiple times in 2018 after multiple hikes in 2017. But when Powell was asked where he felt the Fed was in that cycle and how close they were to the neutral rate, he replied that he felt it was ‘a long way off.’
Markets didn’t seem to take that news lightly as in short order equities had started to tip over and Gold prices began to rally. This didn’t stop the Fed from hiking in December of 2018 while also warning of more possible hikes in 2019, with equities continuing to sell-off in the aftermath.
But 2019 saw a very clear pivot from the FOMC as the bank moved from an aggressive tightening stance into another cutting cycle, cutting rates three times in 2019 and helping to continue the build of that bullish trend in Gold, which held through the 2020 open.
Gold Prices Monthly Chart
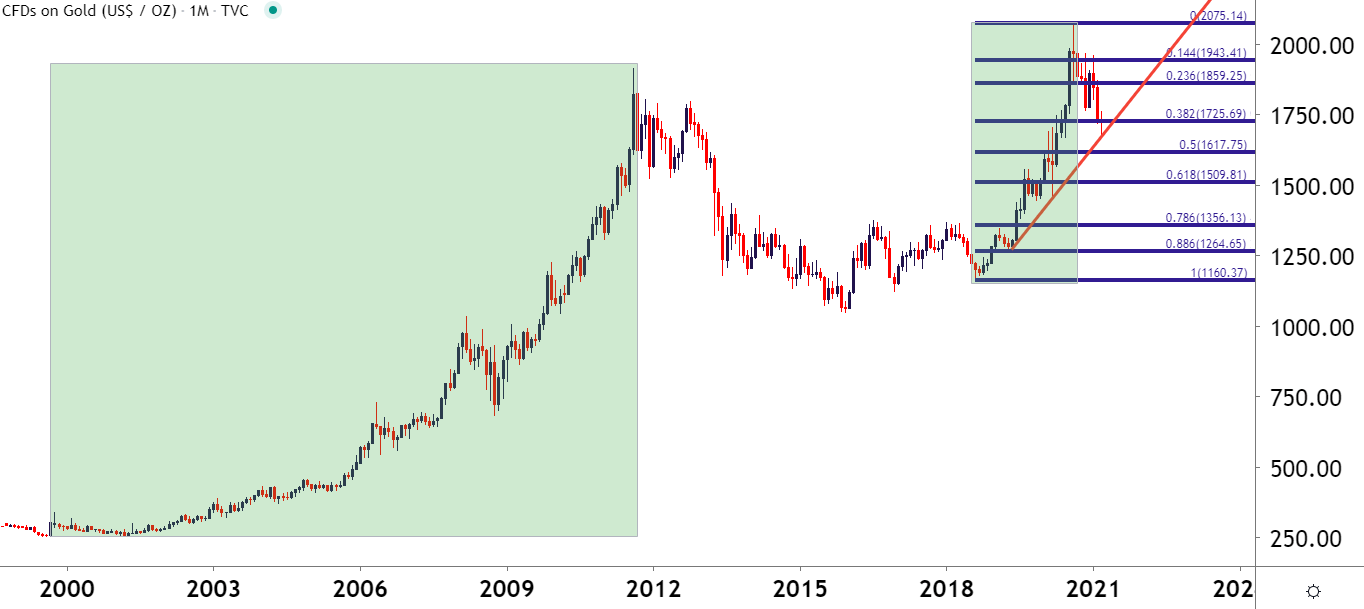
Chart prepared by James Stanley; Gold on Tradingview
The coronavirus pandemic presented disruption everywhere, including the bullish trend in Gold. But the prevailing response from the Federal Reserve unleashed a veritable bazooka of stimulus and in short order risk markets had started to rally again. Gold prices pushed higher through the summer and eventually set a fresh all-time-high in August before starting to pullback.
But that pullback is still ongoing as we have yet to encroach upon that August high and, at this point, price action is continuing to test the 38.2% retracement of the 2018-2020 major move. The 38.2% Fibonacci retracement is an important marker for trend continuation strategies.
To learn more about Fibonacci, check out DailyFX Education
Gold Monthly Price Chart
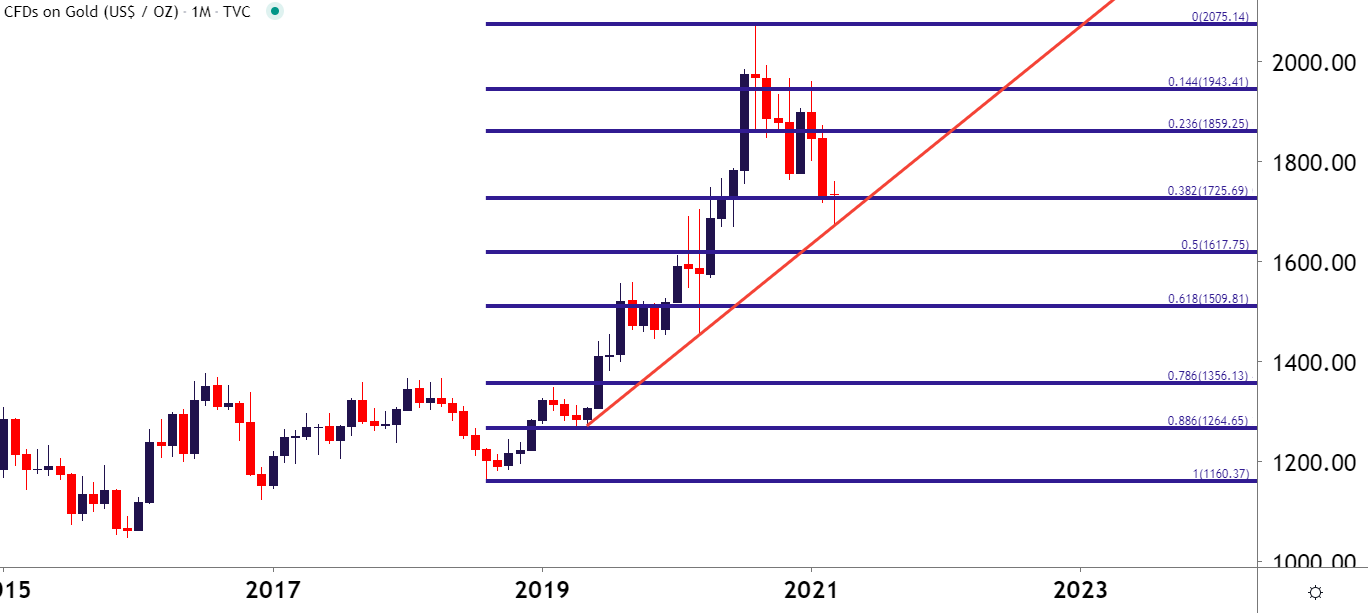
Chart prepared by James Stanley; Gold on Tradingview
That Fibonacci support level came into play on the final trading day of February and remains in the picture a few weeks later. There’s been pushes below and bounces back above but, at this point, price action remains in a state of stasis. On the four-hour chart below, we can see where buyers have been showing support around this level as prices have tested resistance on a bearish trendline projection.
Gold Four-Hour Price Chart
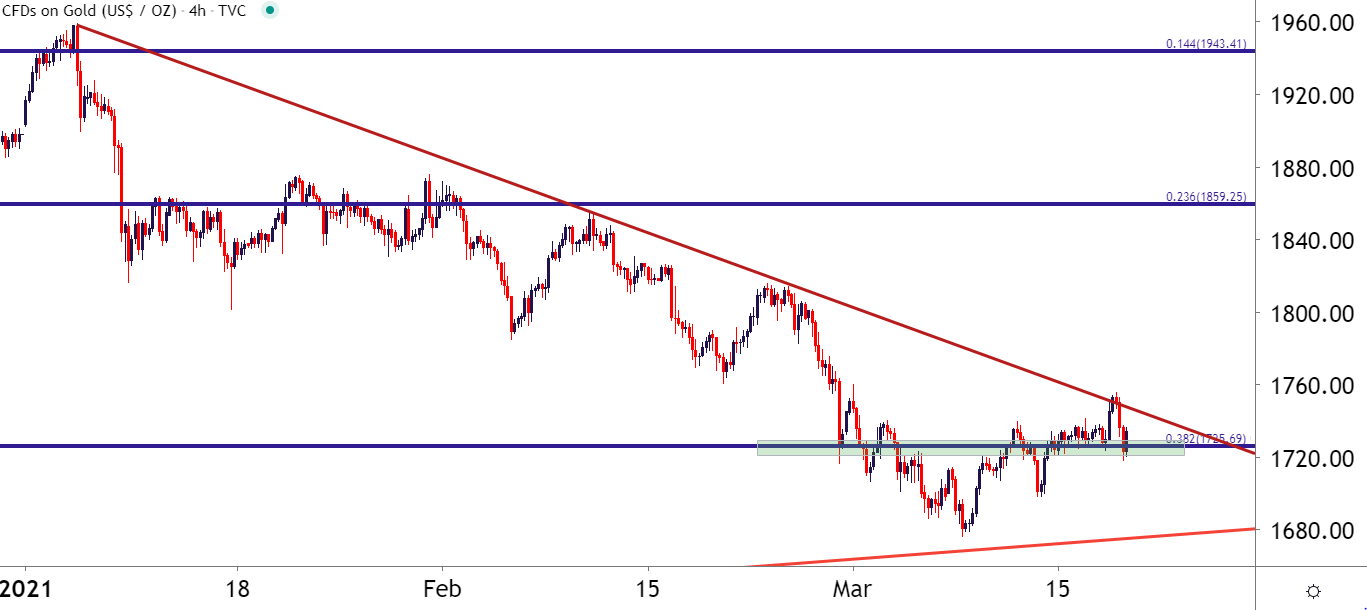
Chart prepared by James Stanley; Gold on Tradingview
--- Written by James Stanley, Strategist for DailyFX.com
Contact and follow James on Twitter: @JStanleyFX