

Gold Price Forecast:
- It was just a month ago that Gold prices surged up to a fresh all-time-high. But price action closed with a bearish engulfing candlestick on August 7th, leading to a strong sell-off in the first few days of the following week.
- The past few weeks have seen continued digestion in Gold, with horizontal support holding from around 1900-1920 to go along with a series of lower-highs.
- Could the next major move in Gold be down before longer-term bullish trends might come back into order?
- To learn more about bearish engulfing patterns or price action, which is utilized heavily in the below analysis, please check out our DailyFX Education section.
Gold Jumps from Support – But Are Bulls Ready to Drive the Trend?
When a market like Gold puts in a move like it did earlier this summer – people have a tendency to remember. And not just remember, there may also be a general tendency to expect that to continue in a similar manner as it had in the past. It’s unfortunate for market participants but that’s simply not the case: Things change, sometimes very quickly, and this can lead many to chasing their tails by trying to trade yesterday’s trends.
In Gold that parabolic-like trend from earlier this summer continues to wreak havoc in traders’ minds, with many looking for another July-like bump to the bid that led to a fresh all-time-high in early-August. But, just as I had looked at then – the fact that prices set an all-time-high doesn’t mean that the same has to happen tomorrow. This also doesn’t necessarily mean that a bearish trend has to follow, either: At all points, the future is unpredictable, and about the best we can do is assimilate probabilities with known facts in the effort of producing some workable analysis.
In Gold, the trend got red-hot in early-August as that parabolic like move broke away to a fresh all-time-high. And Gold didn’t just set a fresh all-time-high- it smashed through it. Gold topped-out at 1920 in 2011 and that level lurked on traders’ charts for almost a decade after. So, one might assume that a recurrent attempt to take out that level might lead to a pause, or perhaps even a pullback, as a really big level on the chart came back into play.
That didn’t happen – nor did price stop at the 2,000 psychological level, which is somewhat bizarre considering that was the first time ever that Gold traded above that big fig. Bulls continued to drive, and drive, and drive through all of those resistances until early-August finally brought along that fresh all-time-high at 2,075, which remains as of today.
The same day that this all-time-high was set, Gold price action put in a bearish engulfing formation – which is often approached with the aim of bearish scenarios. And as I wrote in the forecast that was published that weekend, this could open the door to pullback potential. That pullback potential showed up with aggression as the next week saw prices dip by more than $200 from the recent high.
Gold Four-Hour Price Chart
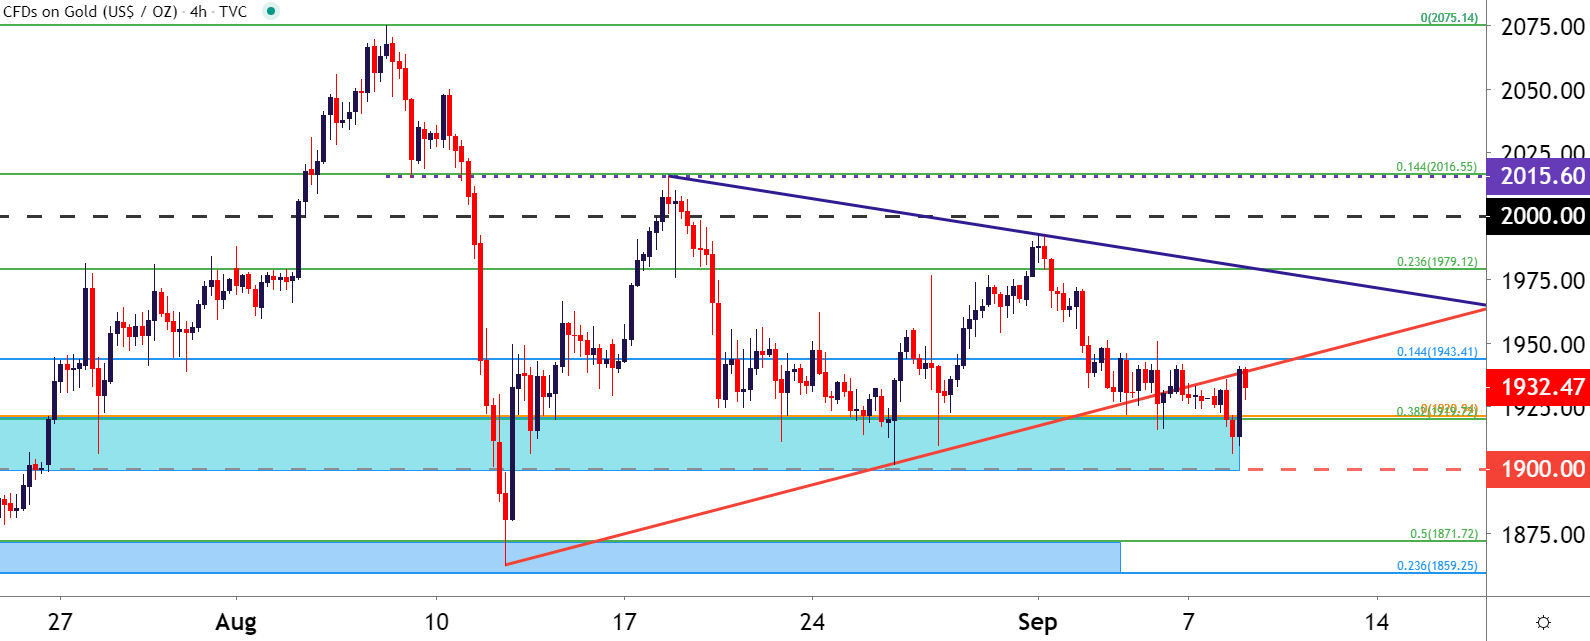
Chart prepared by James Stanley; Gold on Tradingview
In the weeks since that fresh high led into an aggressive pullback, price action has calmed; and until this morning had largely adhered within a symmetrical wedge pattern. Earlier this morning saw price action crawl down for another test of the support zone running from 1900-1920; keeping alive the recent bout of mean reversion as support has elicited yet another key test from price action. The big question now is whether buyers can keep the move alive long enough for fresh highs to come into the equation.
Gold Eight-Hour Price Chart
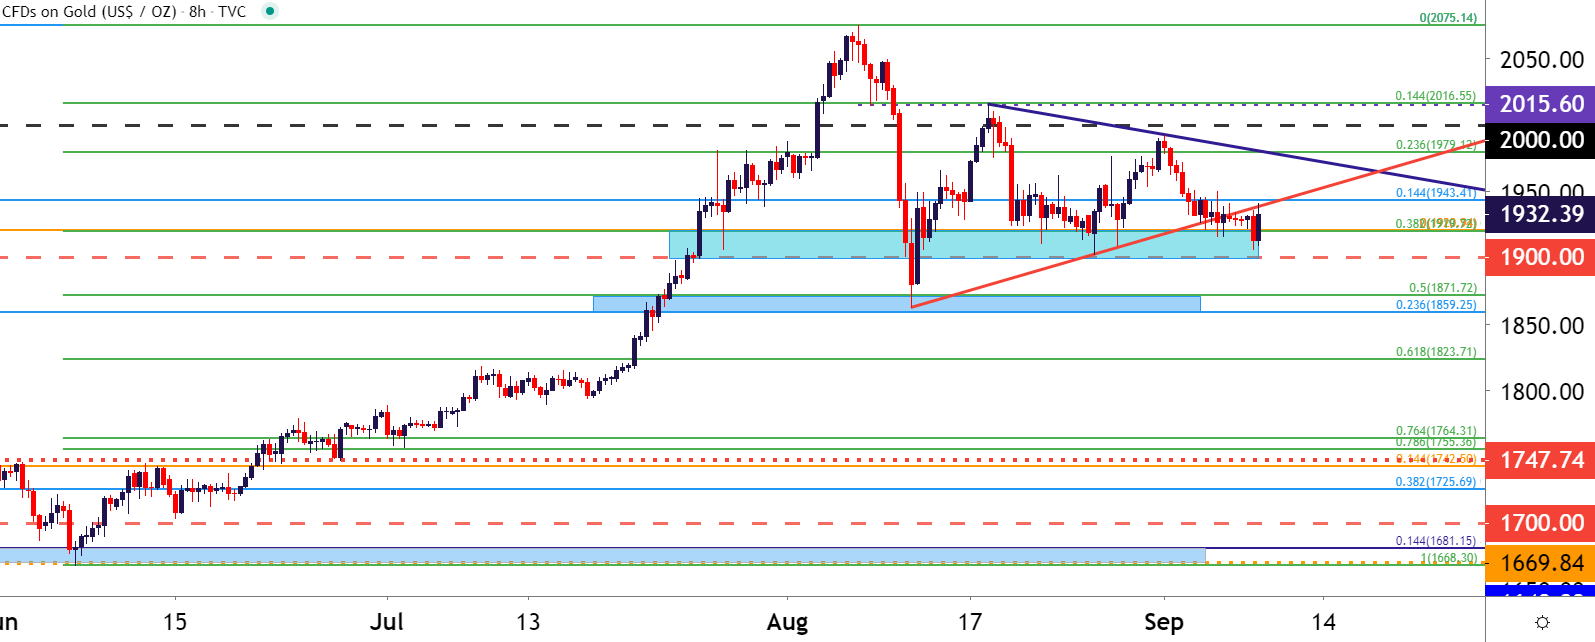
Chart prepared by James Stanley; Gold on Tradingview
Gold Price Near-Term Strategy
This week brings a busy economic calendar into the mix so that’s definitely a consideration; but traders should also take into account dynamics in USD. It was the USD sell-off over the past six months that contributed to that topside run in Gold; and there may be a USD-strength theme in the not-too-distant future. This Thursday’s ECB rate decision appears to have a really strong potential for impact as the Euro is more than 57% of the USD’s composition in the DXY contract – and EUR/USD being rebuffed at 1.2000 appears to be linked to the USD support bounce that’s shown over the past week.
Given that all of these moves have been rather stretched – bullish Gold and EUR/USD along with bearish USD – and there is the possibility for deeper pullbacks in those dominant themes, moves or trends before longer-term continuation may come back into order.
For near-term dynamics, traders can look to support potential on Gold around 1920, 1900 and if those levels are breached – the same zone that caught the August swing-lows, running from 1859-1871. On the resistance side of the coin, 1943 could open the door to short-term bullish scenarios, looking for deeper tests around 1955 and then 1980.
Gold Two-Hour Price Chart

Chart prepared by James Stanley; Gold on Tradingview
--- Written by James Stanley, Strategist for DailyFX.com
Contact and follow James on Twitter: @JStanleyFX