

Dow, S&P 500, Nasdaq 100 Price Analysis
- Selling pressure has reappeared in US equity indices.
- The big question is whether this is a mere pullback in a bigger-picture bullish trend or, whether the past seven weeks of strength was that pullback before bears re-take control.
Directional Dilemma in US Stocks
It’s been a pretty astounding turnaround from the late-March lows across US equities. While all of the Dow, S&P 500 and Nasdaq 100 lost about a third of their value in a six-week-stretch, the bullish push since has been pretty remarkable, as well. The Nasdaq 100 gained as much as 41% from those March lows, while the Dow put in a gain of as much as 36.8% and the S&P 500 as much as 36.4%. All large numbers, by any stretch of the imagination; but now that stocks have shown some semblance of recovery, the big question is what’s next?
On the bearish side of the argument – there’s still a considerable number of unknowns out there. As some areas begin re-opening, will another wave of infections cause yet another shutdown? And even if they don’t, how will consumers respond? It seems unlikely that matters will just go back to what they were only three months ago – with restaurants full and public transportation packed. Social distancing guidelines remain in a number of areas so, its logical to imagine some continued economic pressure for a number of business lines.
What happens to commercial real estate? Or US-based oil firms that may now be operating below break-even levels? A number of risk factors remain and the longer that the US stays shut down, the louder those factors can become.
On the bullish side of the coin: The US Government. They’ve already done multiple rounds of stimulus/aid and it’s unlikely that this will stop anytime soon. What was once unthinkable (QE) has now not only become commonplace but a regularly-employed vehicle in the monetary toolbox at the FOMC. There was considerable friction across markets when bailouts were being put in-place in 2008; and rampant expectations for runaway inflation down-the-road on the basis of QE. The inflation part never really happened, at least in the runaway matter that many had feared; so it now appears that stimulus and QE are a bit more widely-accepted simply because the first three rounds out of the US haven’t yet ended in catastrophe.
Nasdaq 100 Pulls Back After An Aggressively Bullish Run
In the textbooks, tech is usually considered to be one of the hardest hit areas of the market when major sell-offs, recessions or pullbacks happen. The logic being, when companies are tightening up and getting more risk averse, they often don’t spend on tech investments or growth initiatives which, in-turn, create an amplified affect for many tech companies.
But, that logic doesn’t include Facebook, Amazon, Netflix, Google or even Apple; all companies that can arguably look at what’s happened over the past three months as some form of a bullish driver. People have much more time at home, and they can’t connect socially – so these consumer tech offerings have a greater proportion of peoples’ attention (and time).
The Nasdaq 100 put in a more shallow pullback in February-March, and the following bullish run was a bit stronger, showing at 41% versus 36.4 and 36.8% in the S&P and Dow, respectively. On the weekly chart below, notice how the Nasdaq 100 caught support in March at the trendline projection taken from 2016 and 2018 swing lows, with an assist from the 50% retracement of the 2016-2020 major move.
Nasdaq 100 Weekly Price Chart

Chart prepared by James Stanley; Nasdaq 100 on Tradingview
At this point, the Nasdaq 100 is testing a Fibonacci level around 8907.7, which is the 14.4% marker of that 2016-2020 major move.
Nasdaq 100 Four-Hour Price Chart

Chart prepared by James Stanley; Nasdaq 100 on Tradingview
S&P 500 Stumbles at Fibonacci Resistance
In the S&P 500, the index has continued to struggle around the 61.8% Fibonacci retracement of the February-March sell-off. On the weekly chart below, notice how the March low moved all the way down to the 76.4% retracement of the 2016-2020 major move – while the above chart of the Nasdaq 100 showed a similarly placed Fibonacci setup providing support around the 50% marker.
S&P 500 Weekly Price Chart
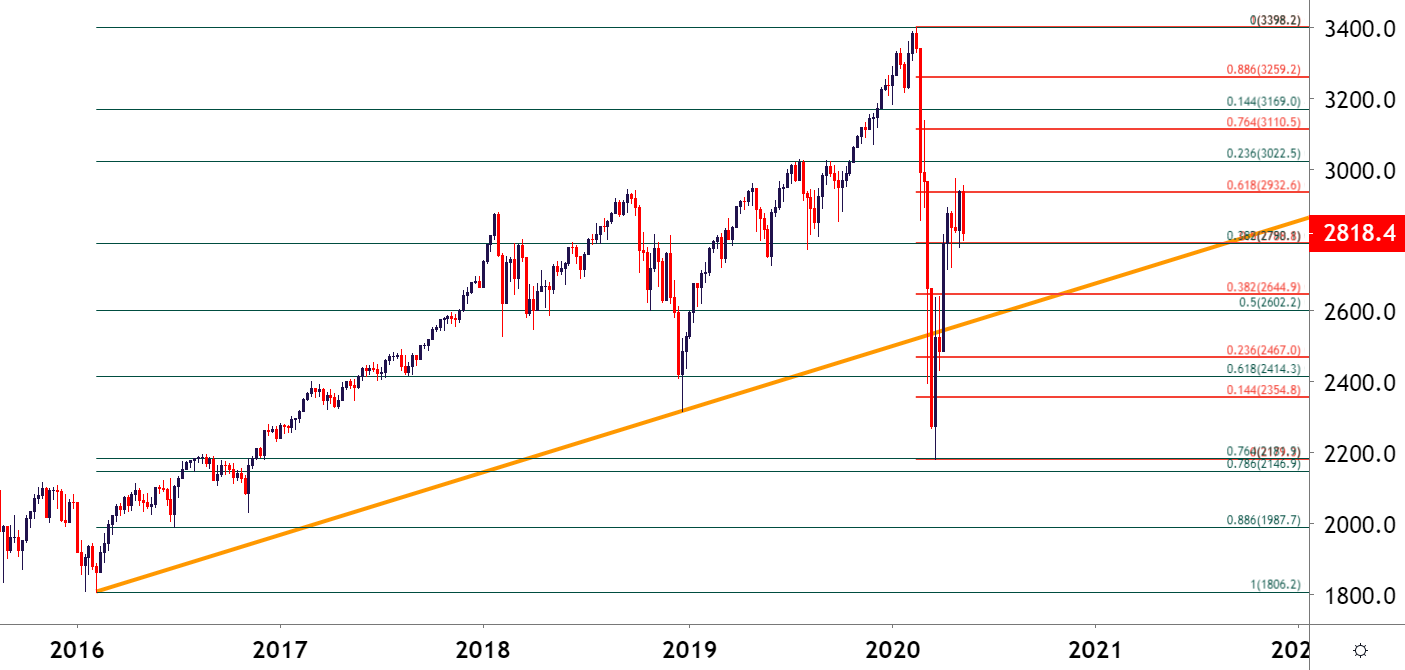
Chart prepared by James Stanley; SPX500 on Tradingview
On a shorter-term basis, the index is now testing a confluent area of support as both the 50% marker of the February-March pullback and the 38.2% retracement of the 2016-2020 major move align very closely with one another. This confluence of support could be potentially interesting to equity bulls investigating the long side of the index.
S&P 500 Four-Hour Price Chart
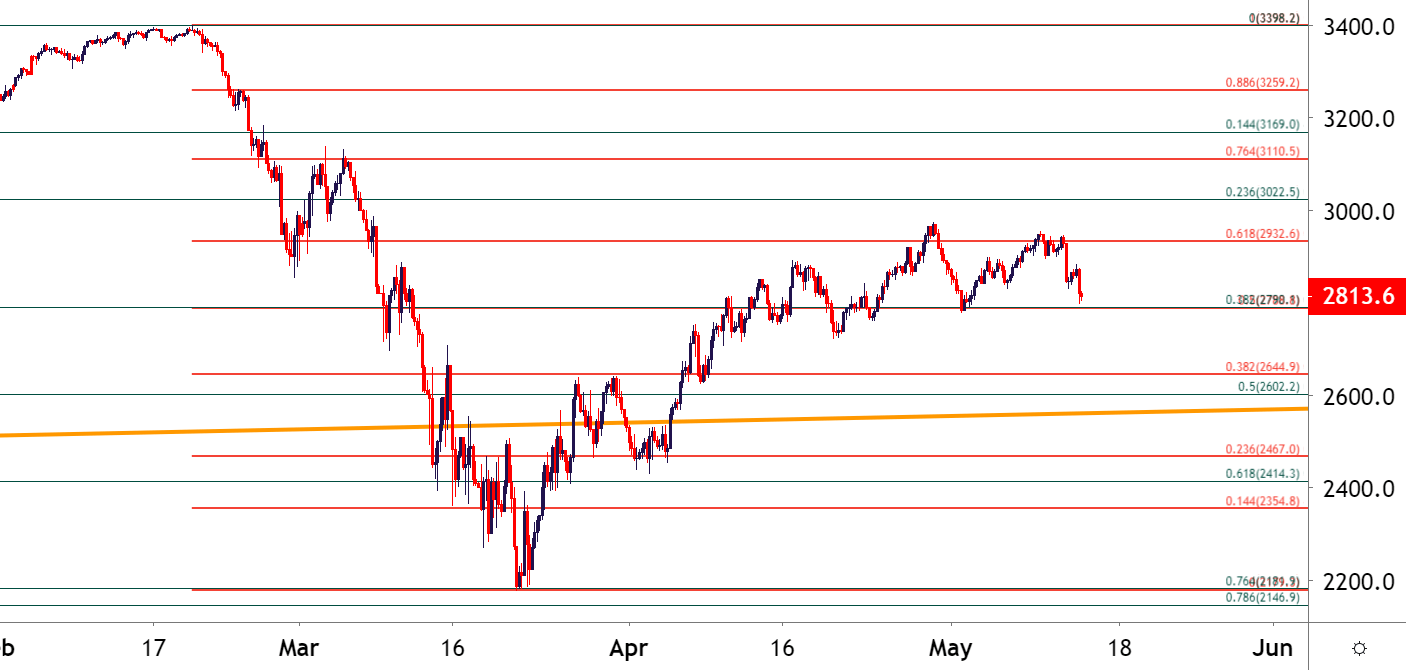
Chart prepared by James Stanley; SPX500 on Tradingview
The Dow as a Laggard
The blue chip index has been hit incredibly hard by the coronavirus scenario and may remain on some rather uneasy footing. Remember back to that trendline shared earlier on the Nasdaq 100 – the projection of which helped to catch the March low.
Well a similarly-placed trendline in the Dow Jones Industrial Average has continued to function as resistance, and prices have yet to pose a meaningful climb-above since it’s come back into play over the past 4.5 weeks.
Dow Jones Weekly Price Chart

Chart prepared by James Stanley; Dow Jones on Tradingview
At this point, the Dow has already moved down to a fresh 2.5 week low while both the S&P and Nasdaq 100, at least not yet. This highlights how the Dow Jones may be one of the more attractive indices to continue focusing on for bearish strategies around US equities.
Dow Jones Four-Hour Price Chart
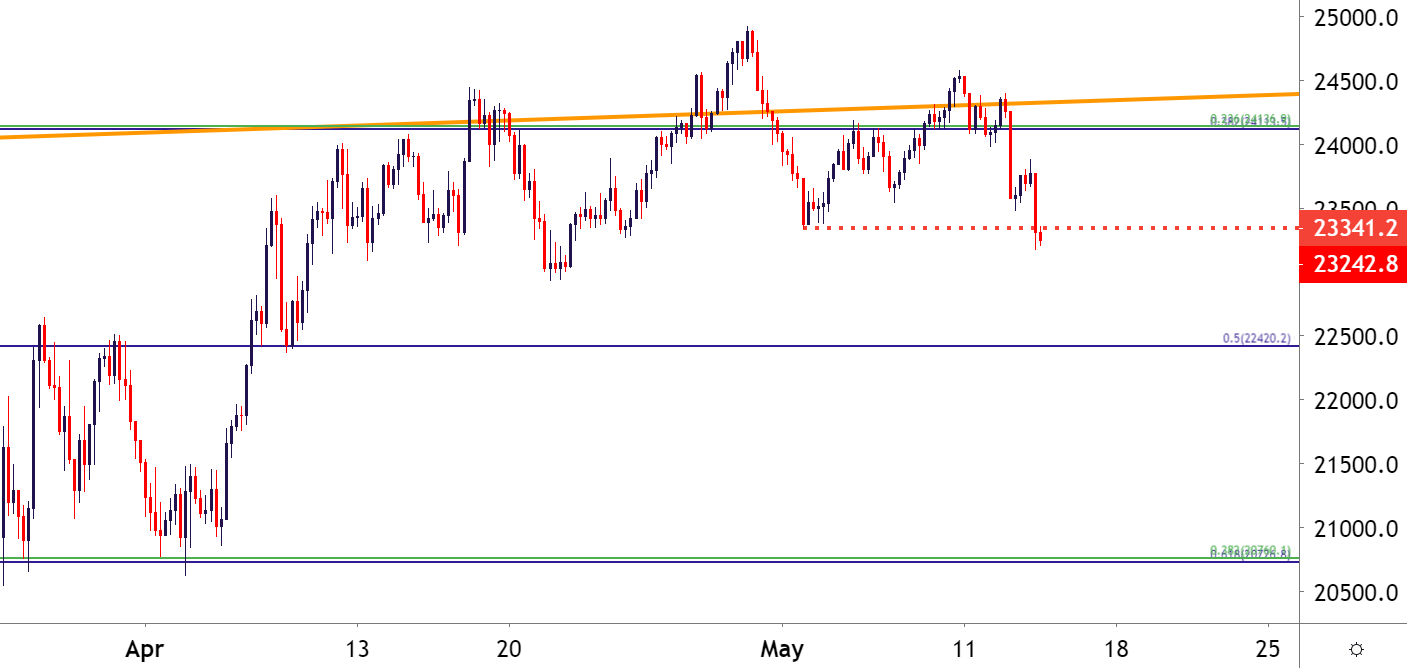
Chart prepared by James Stanley; Dow Jones on Tradingview
--- Written by James Stanley, Strategist for DailyFX.com
Contact and follow James on Twitter: @JStanleyFX