

Dow Jones, Russell 2000, Nasdaq 100 Price Forecast:
- The week opened with a bang on positive news of a breakthrough in the hunt for a Covid vaccine.
- The Dow jumped up to a fresh all-time-high, and the Russell 2000 isn’t far behind as buyers continue to drive in small caps.
- Curiously, the Nasdaq 100 has been on its heels so far this week, testing a huge zone of potential support. The Nasdaq was the high-flyer from the March lows, jumping by as much as 88%. Why would the tech-heavy index be lagging now that there’s positive news on the horizon?
- The analysis in this article heavily utilizes price action and chart patterns. To learn more about price action, check out our DailyFX Education section, where it’s taught amongst a host of other candlestick patterns and formations.
It’s been a brutal stretch in the headlines this year, and perhaps even more so over the past month as the US Presidential Election dominated the airwaves. But yesterday produced something of a positive note as news circulated that Pfizer’s vaccine candidate is currently showing a 90% efficacy rate.
The timing of the announcement, however, is somewhat curious, as the study being quoted isn’t even finished yet. And given the timeline of Covid infections, the early stage of those results is somewhat questionable and very much out of the norm for a drug trial: When the study concludes, we very well may be looking at a lower efficacy rate; but as long as that rate is above 50%, it’s widely thought that the drug would end up being approved.
Perhaps the more exciting part of those results wasn’t necessarily the drug itself as much as how the drug works: Pfizer’s vaccine is based on messenger RNA, which is quite a bit different than how many other vaccines work by inoculating with a form of the live virus. What’s exciting about mRNA is both the fact that this could be replicated for other maladies down the road, and there are other drug companies using similar technology in their own vaccines; such as we heard Dr. Fauci remark on yesterday in regards to the Moderna vaccine.
So, taking a step back to look at the big picture: There is hope that light may be at the end of the tunnel somewhere. But, its merely hope at this point, with a probability as to whether these drugs will actually ‘work,’ and we won’t have more info on that until later in the month after Pfizer has been able to accumulate more results in their current trial.
Perhaps even more curious was the market response to this news with one of the clear take-aways being higher rates in the US. The 10-year note is currently trading at its highest level since March, as the virus was getting priced-in to markets. The Dow Jones Industrial Average opened the week with a bang, finally pushing up to a fresh all-time-high. Up until yesterday, the Dow had been the laggard with the Nasdaq pushing up to a fresh high in June and the S&P following a couple of months later.
That move in the Dow has since moderated a bit, with prices pulling back and the index is currently trading around the September swing-high.
To learn more about breakouts, check out our chart patterns section in DailyFX Education
Dow Jones Daily Price Chart
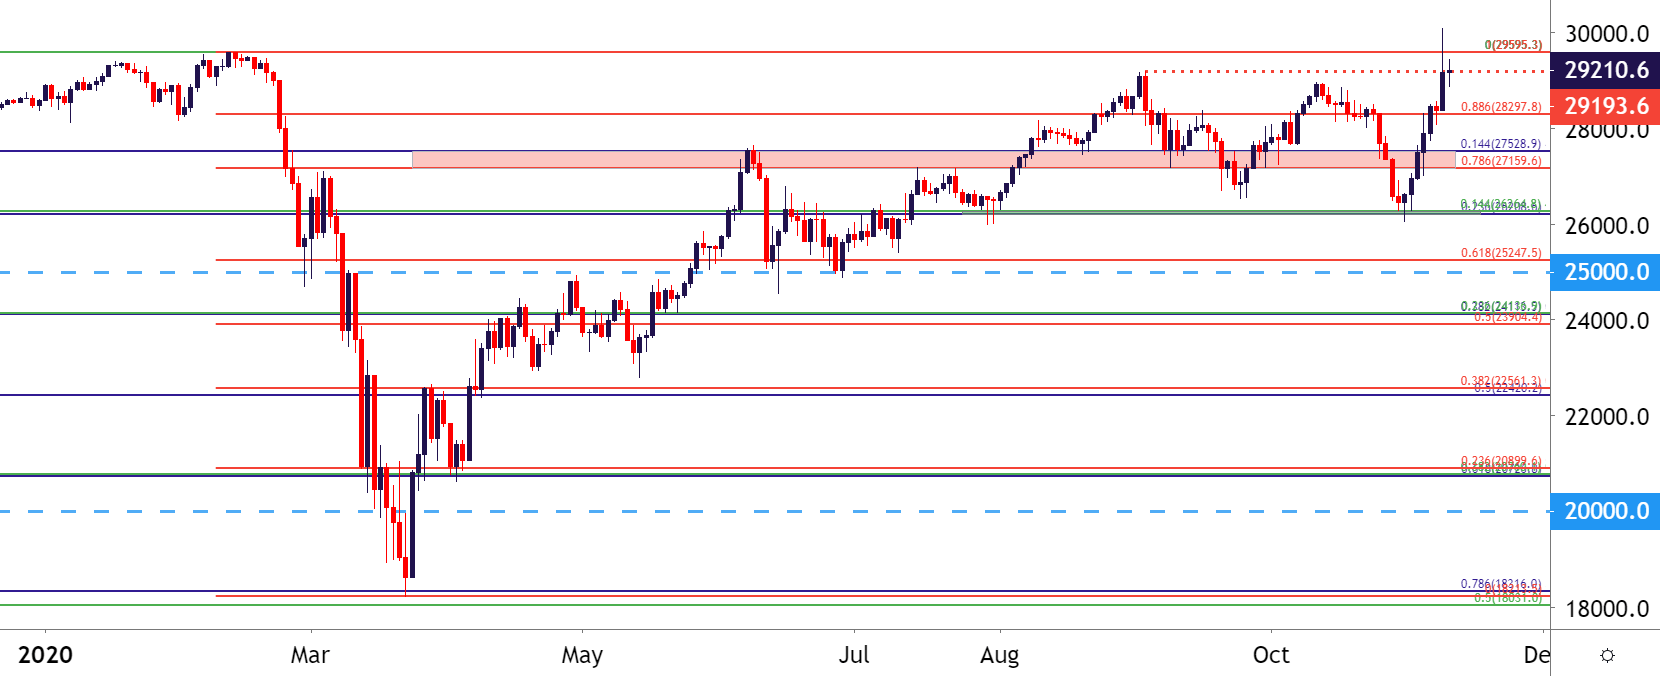
Chart prepared by James Stanley; Dow Jones (DJIA) on Tradingview
Smalls Are Where It’s At
The index that’s seemed to rally the most on this news, and also the index that’s given back the least since that Monday opening pop, is the Russell 2000. Representing small cap stocks, the Russell was hit incredibly hard in March, giving back as much as -43% from the Feb high to the March low. This is more than the -32.05% given back in the Nasdaq 100 or the -35.69% taken-out in the S&P 500.
But – if this positive news is going to continue and if we are nearing a vaccine with a sooner-than-hoped-for ‘return to normal,’ small cap stocks could benefit massively.
At this point, the Russell 2000 is testing the underside of an old bullish trendline, posturing around the 2020 high and very near the all-time-high which hasn’t been tested in more than two years.
Russell 2000 Monthly Price Chart
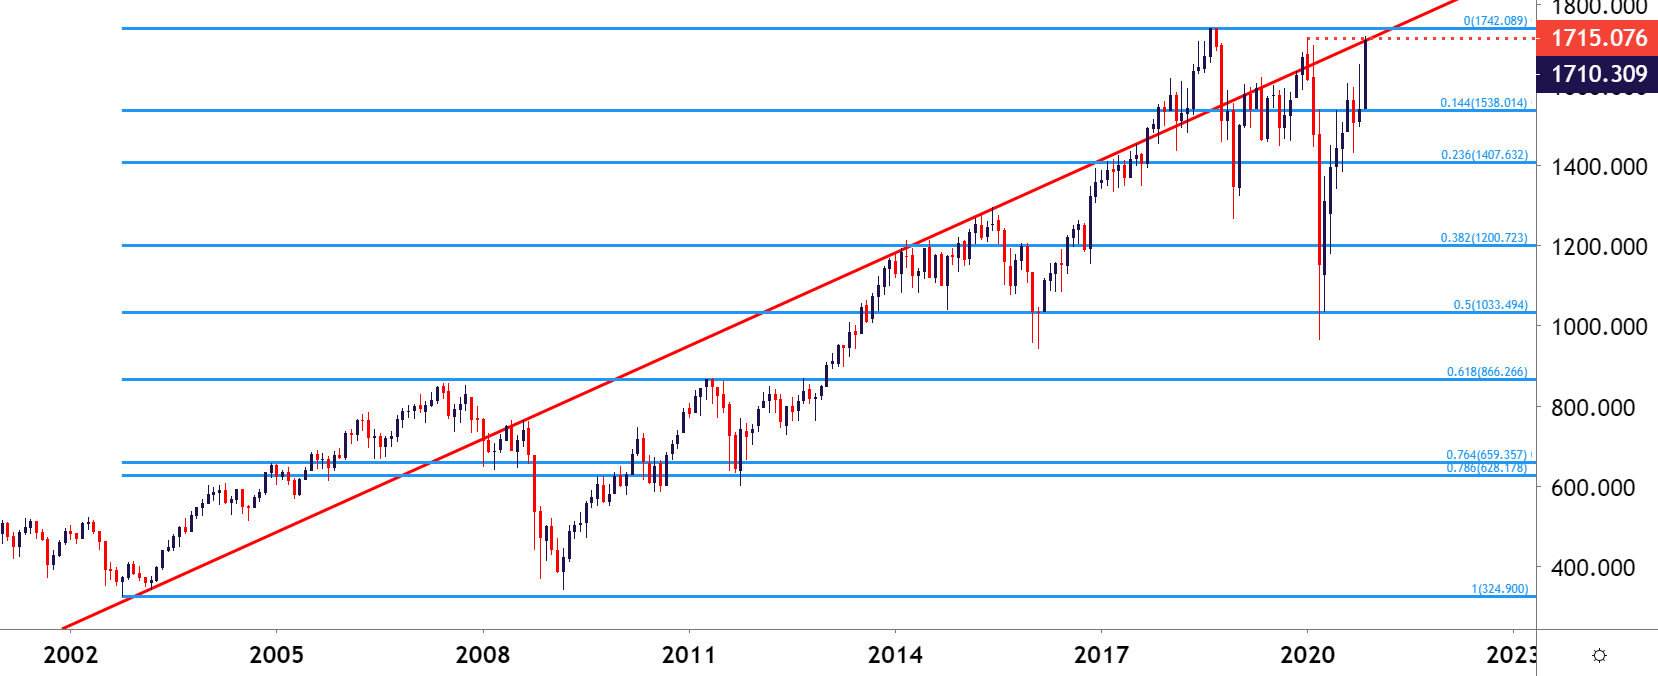
Chart prepared by James Stanley; Russell 2000 on Tradingview
Nasdaq 100 Crawls Back to Key Support
This is where things get a bit messier…
Ever since equities came back to life in March, the Nasdaq led the way amongst major US equity indices, gaining as much as 88% from the March low up to the September high. This goes along with the initial sell-off as Covid was getting priced-in as well, as the Nasdaq 100 dropped by -32.05% versus larger sell-offs in the S&P (-35.69%) and the Dow Jones Industrial Average (-38.4%).
By comparison, the S&P 500 gained as much as 64.68% from the March lows while the Dow has gained as much as 65.2% (using yesterday’s fresh all-time-high).
So, by pretty much any vantage point tech heavily outperformed: But that paradigm appears to be shifting in front of us, and yesterday was a clear example of that as the Nasdaq 100 languished back into a support zone as the Dow jumped up to that fresh all-time-high and the Russell 2000 continues to drive.
For those that are bullish and optimistic, this support hold in the Nasdaq could be a very interesting item to follow for the days ahead.
But for those that want to infer signs from the failure of the Nasdaq to track along with small caps, this could be highlighting the potential for reversal plays in other indices, such as the Dow.
Nasdaq 100: Welcome Back, Support
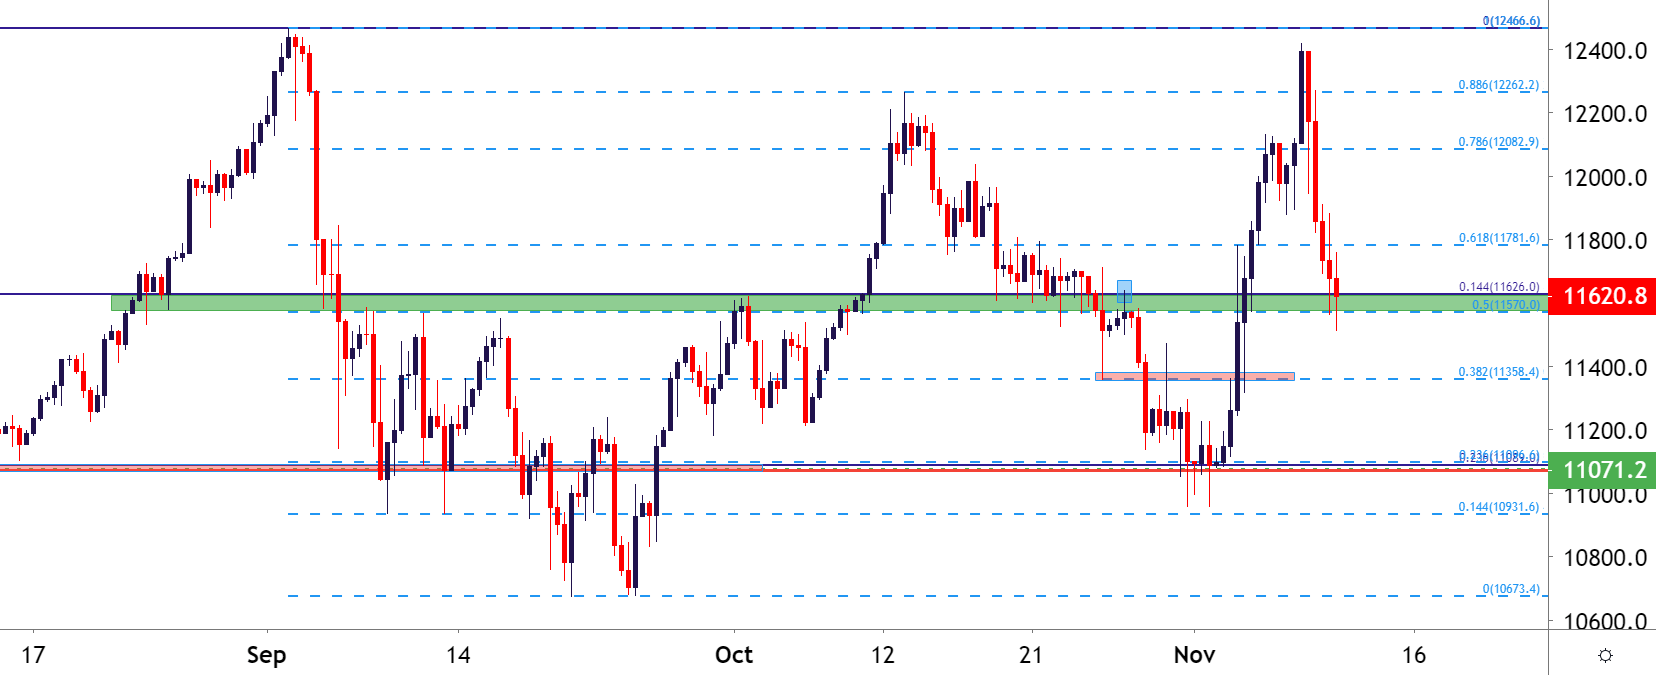
Chart prepared by James Stanley; Nasdaq 100 on Tradingview
Forex: Voicing this theme through FX Pairs
Perhaps an even cleaner variant for this theme exists in FX-land, and this is likely related to the rates theme as the 10-year has perked up to its highest yield since March.
USD/JPY has been rather unexciting for the bulk of 2020 trade, even with a leadership change in the world’s third largest national economy. The pair closed last week’s trade with a support hold above a longer-term Fibonacci level at 103.11, and prices put in a strong topside breakout as Covid vaccine news was getting priced-in.
USD/JPY price action has since found resistance at a key Fibonacci level, with 105.40 functioning as the 38.2% retracement of the 2020 major move. The battle lines may be a little more clear here, as those that are bullish on a vaccine or a faster-than-hoped-for return to normal could look at topside breakout potential; and for those that’d like to fade this move driven by hope and excitement looking at a mean-reversion scenario in the pair.
USD/JPY Eight-Hour Price Chart: Resistance Hold After Big Bullish Move
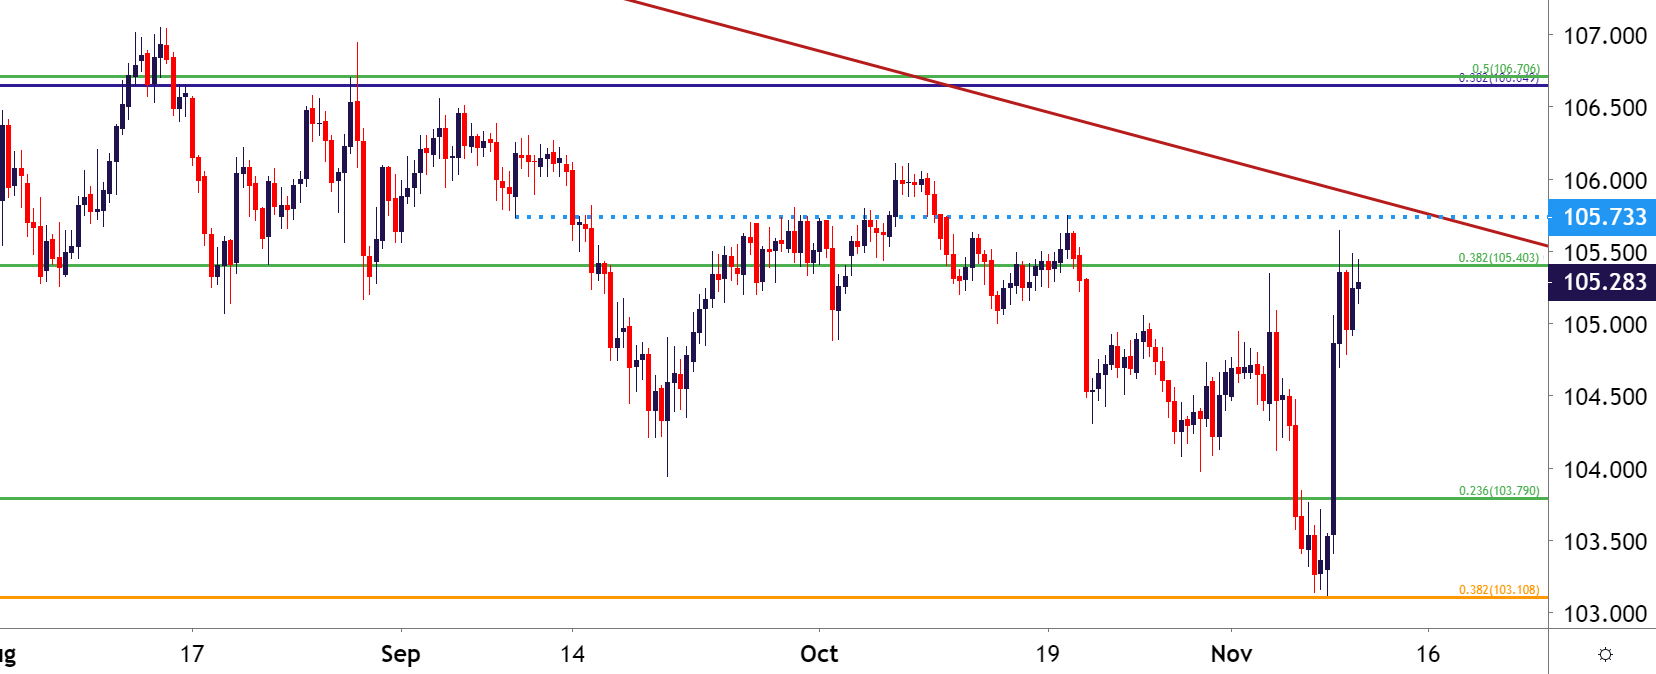
Chart prepared by James Stanley; USDJPY on Tradingview
--- Written by James Stanley, Strategist for DailyFX.com
Contact and follow James on Twitter: @JStanleyFX