
Dow Jones Industrial Average, Russell 2000, US Senate, Stimulus Payments – Talking Points:
- Equity markets traded mixed during APAC trade on year-end flows.
- The move to block swift package of enhanced stimulus payments may undermine US benchmark equity indices.
- Dow Jones Industrial Average at risk of a short-term pullback as prices carve out a Rising Wedge pattern.
- The Russell 2000 may extend its recent slide lower.
Asia-Pacific Recap
Equity markets traded mixed during Asia-Pacific trade as investors mulled the pace of global vaccine distributions and squared off their positions ahead of the end of the year.
Australia’s ASX 200 index fell 0.27% as the nation’s most populous state recorded an additional 18 cases of the novel coronavirus, while Japan’s Nikkei 225 index slipped 0.45% lower.
In FX markets, the cyclically-sensitive AUD, NZD and NOK largely outperformed while the haven-associated USD plunged lower against its major counterparts.
Gold and silver prices nudged marginally higher as yields on US 10-year Treasuries held relatively steady at 0.94%.
Looking ahead, US pending home sales for November and EIA crude oil inventories headline a rather light economic docket.

Market reaction chart created using Tradingview
Delayed Stimulus Check Vote May Undermine US Equity Indices
Senate Majority Leader Mitch McConnell’s move to prevent the swift passage of larger stimulus checks to millions of Americans may weigh on US benchmark equity indices in the coming days.
McConnell promptly shot down Democrat’s calls for a stand-alone vote on the $2000 payments originally proposed by President Donald Trump and instead announced that he will tie all three of the President’s demands into one bill. Trump has pushed for an investigation into alleged election fraud and the dissolution of Section 230 of the 1996 Communications Decency Act – a law that shields social media companies from being liable for what their users post.
However, this is viewed as somewhat of a poison pill by many Democrats, with Senate Minority Leader Chuck Schumer stressing that a bill inclusive of all three demands “will not pass the House and cannot become law”. Schumer added that “any move like this by Senator McConnell would be a blatant attempt to deprive Americans of a $2,000 survival check”.
With the majority of Senate Republicans vehemently opposing a stimulus package of greater than $1 trillion, and the provision of larger stimulus payments estimated to cost an additional $463 billion, it seems relatively unlikely that Congress will pass the House’s bill.
Therefore, US stock indices may come under pressure in the coming days as investors key in on the outcomes of the two run-off races in Georgia, which will ultimately decide the balance of power in the Senate. A Democratic sweep likely opens the door for further stimulus in the New Year and could trigger further upside for regional asset prices.
Dow Jones Index Futures Daily Chart – Rising Wedge Hints at Short-Term Pullback
Dow Jones index futures daily chart created using Tradingview
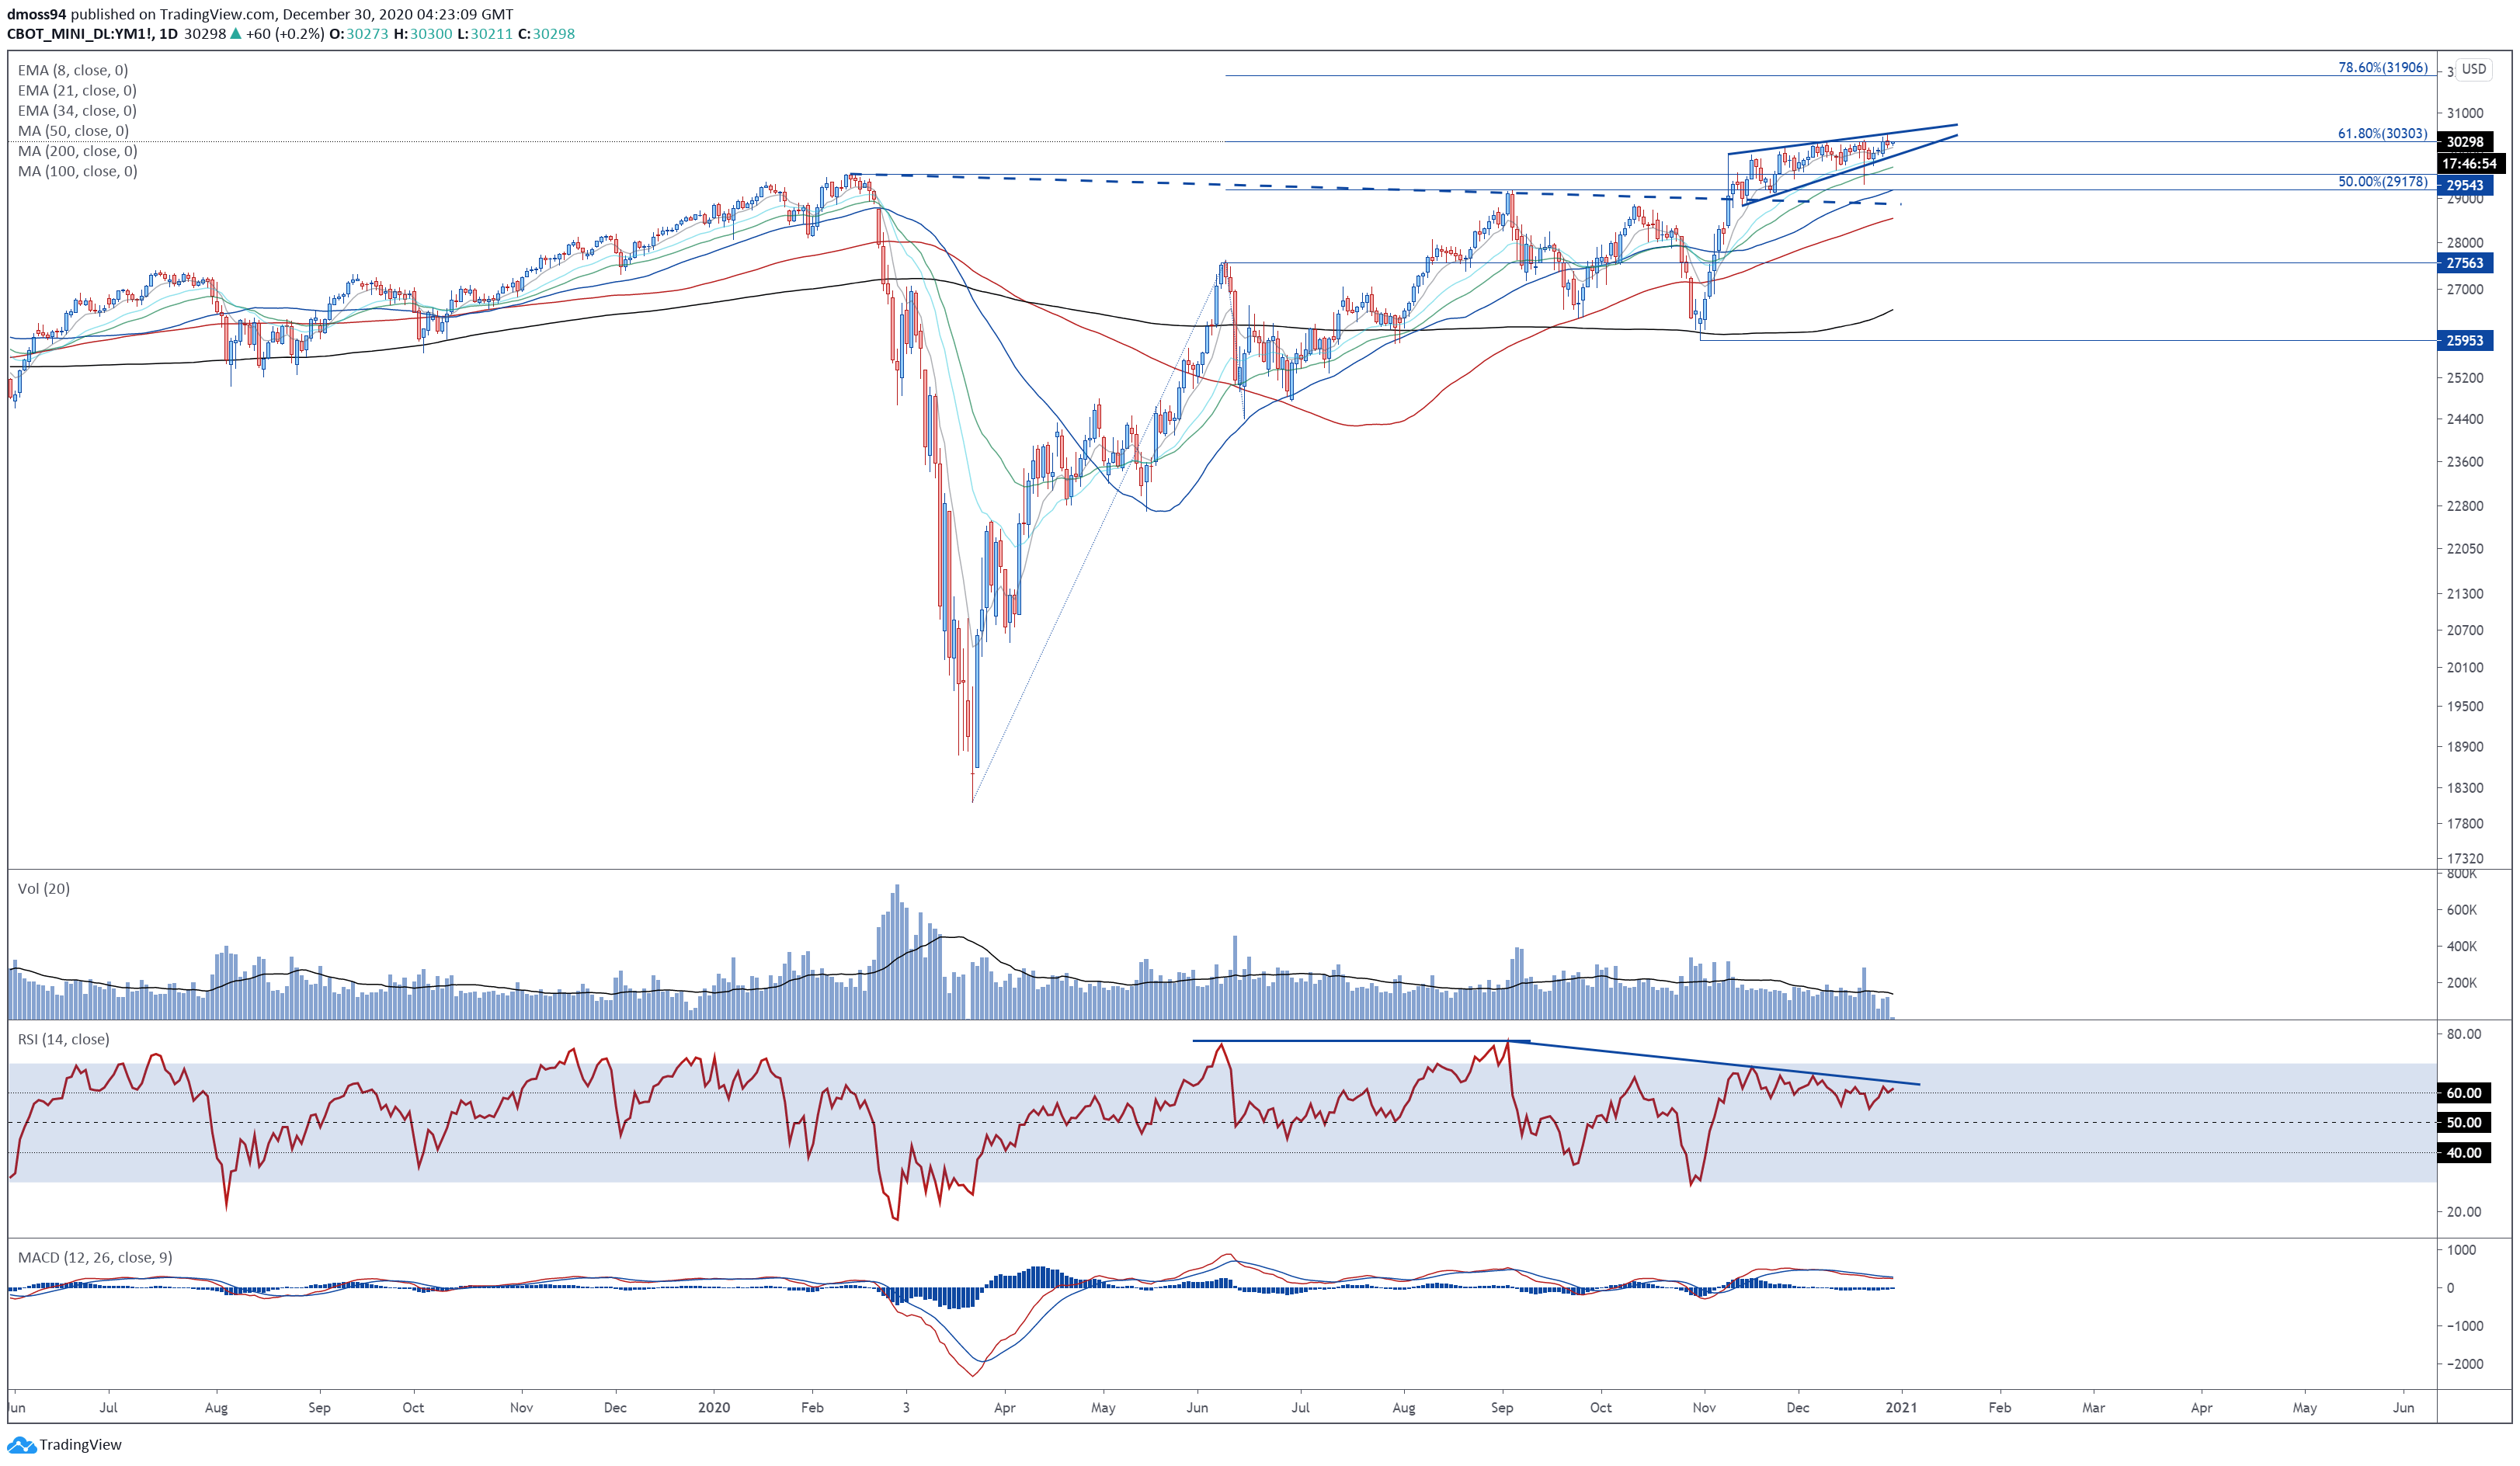
From a technical perspective, the benchmark Dow Jones Industrial Average (DJIA) could be at risk of a short-term pullback as prices carve out a bearish Rising Wedge pattern.
Bearish RSI divergence and a notable drop-off in volume hints that the recent topside push may be running out steam.
Failing to close on a daily basis above wedge resistance and the December 29 high (30502) could ignite a correction back towards the 21-day exponential moving average (29982) and wedge support.
Clearing that would likely validate the bearish pattern and carve a path for sellers to drive price back towards the 50% Fibonacci (29178) and trend-defining 50-day moving average.
Alternatively, pushing past the 30500 mark would likely signal the resumption of the primary uptrend and bring psychological resistance at 31000 into the crosshairs.
Dow Jones Index Futures 4-Hour Chart – Perched Precariously Above Key Fibonacci Support

Dow Jones index futures 4-hour chart created using Tradingview
Zooming into a four-hour chart bolsters the short-term bearish outlook depicted on the daily timeframe, as the Dow Jones’ attempted push above Rising Wedge resistance and the 30500 mark is swiftly rejected.
A bearish crossover on the MACD indicator, in tandem with the RSI dipping sharply back below 60, suggests the path of least resistance may be lower.
Falling back below the 61.8% Fibonacci (30303) could trigger a more extensive pullback towards the December 27 low (29956), with a break below likely carving a path for sellers to challenge wedge support and the sentiment-defining 200-DMA (29861).
On the other hand, a retest of the yearly high (30502) could be in the offing if the 61.8% Fibonacci remains intact.
Russell 2000 Index Futures Daily Chart – Correction Lower in the Making?
Russell 2000 index futures daily chart created using Tradingview
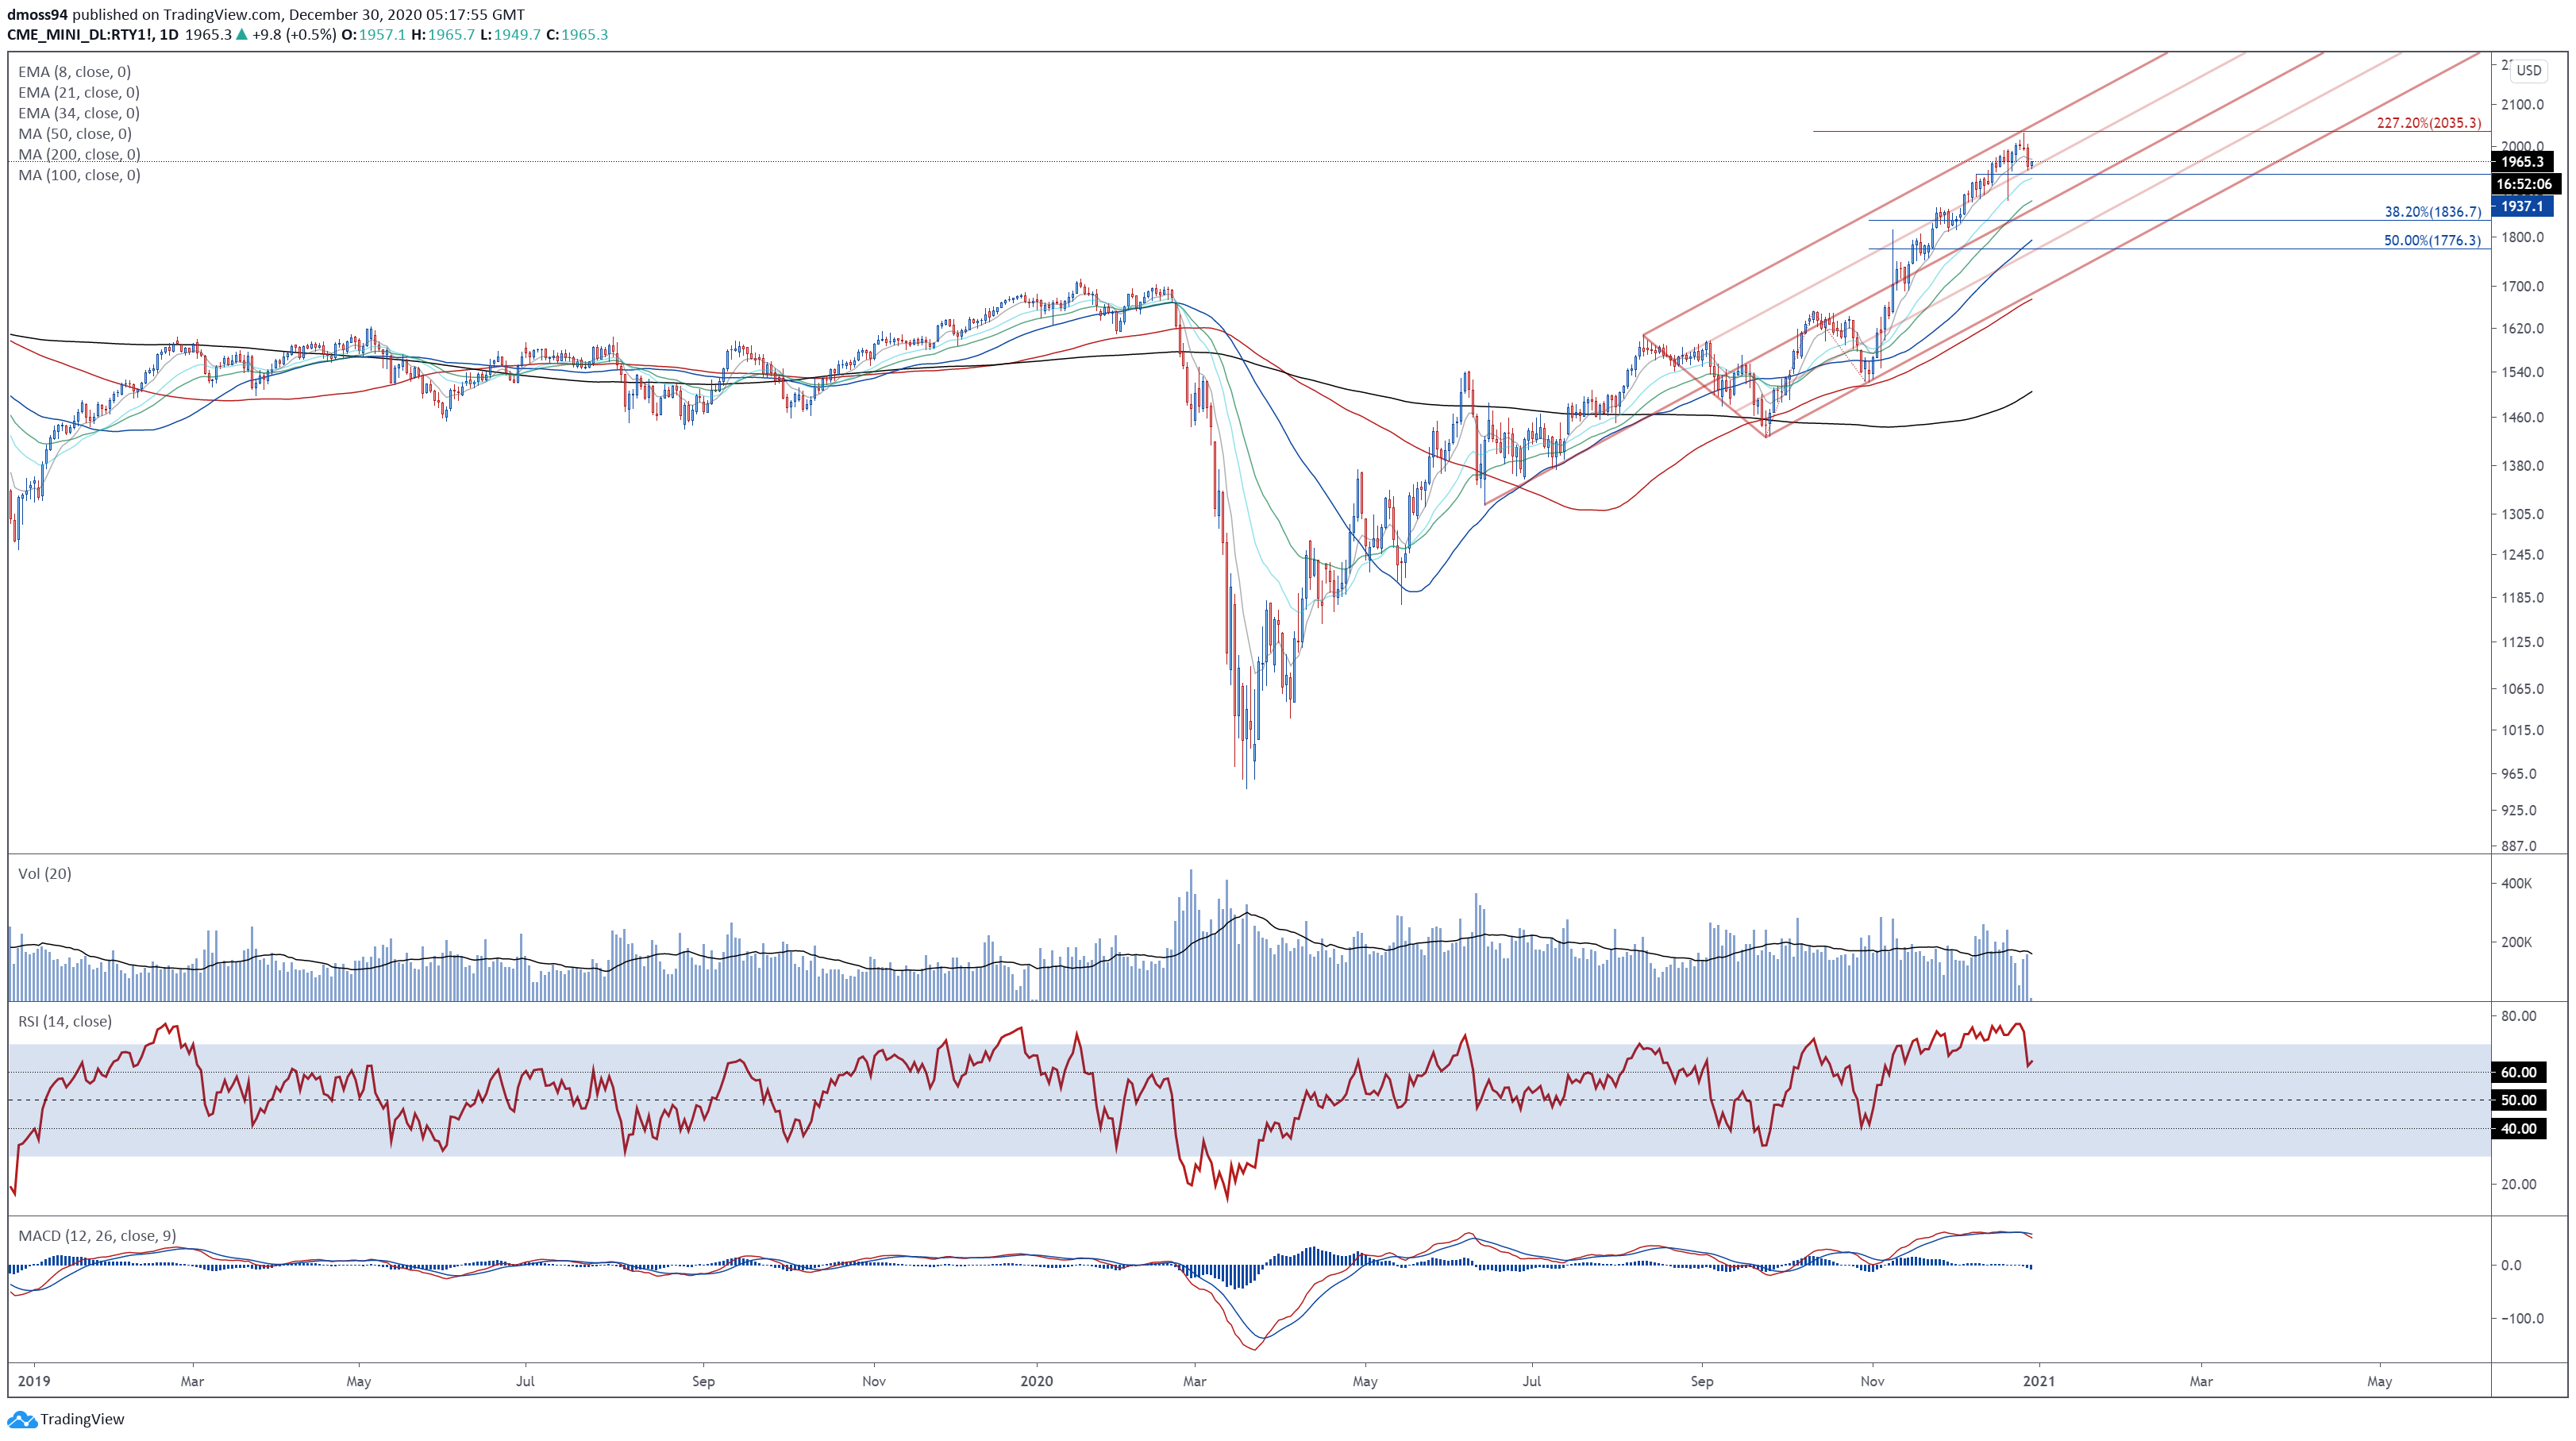
The Russell 2000 index could also be at risk of a more extended pullback, as prices slip back below 2000 and the 8-EMA (1971.3).
With the RSI diving back into normal territory, and a bearish crossover taking place on the MACD indicator, the path of least resistance seems to favour the downside.
A daily close back below confluent support at the Pitchfork 50% parallel and 1950 mark could intensify selling pressure in the near term and open the door for price to challenge support at the November high (1864).
Conversely, a retest of the yearly high (2032) may be on the cards if price remains constructively perched above 1950.
Russell 2000 Index Futures 4-Hour Chart – MACD Hints at Further Losses
Russell 2000 index futures 4-hour chart created using Tradingview
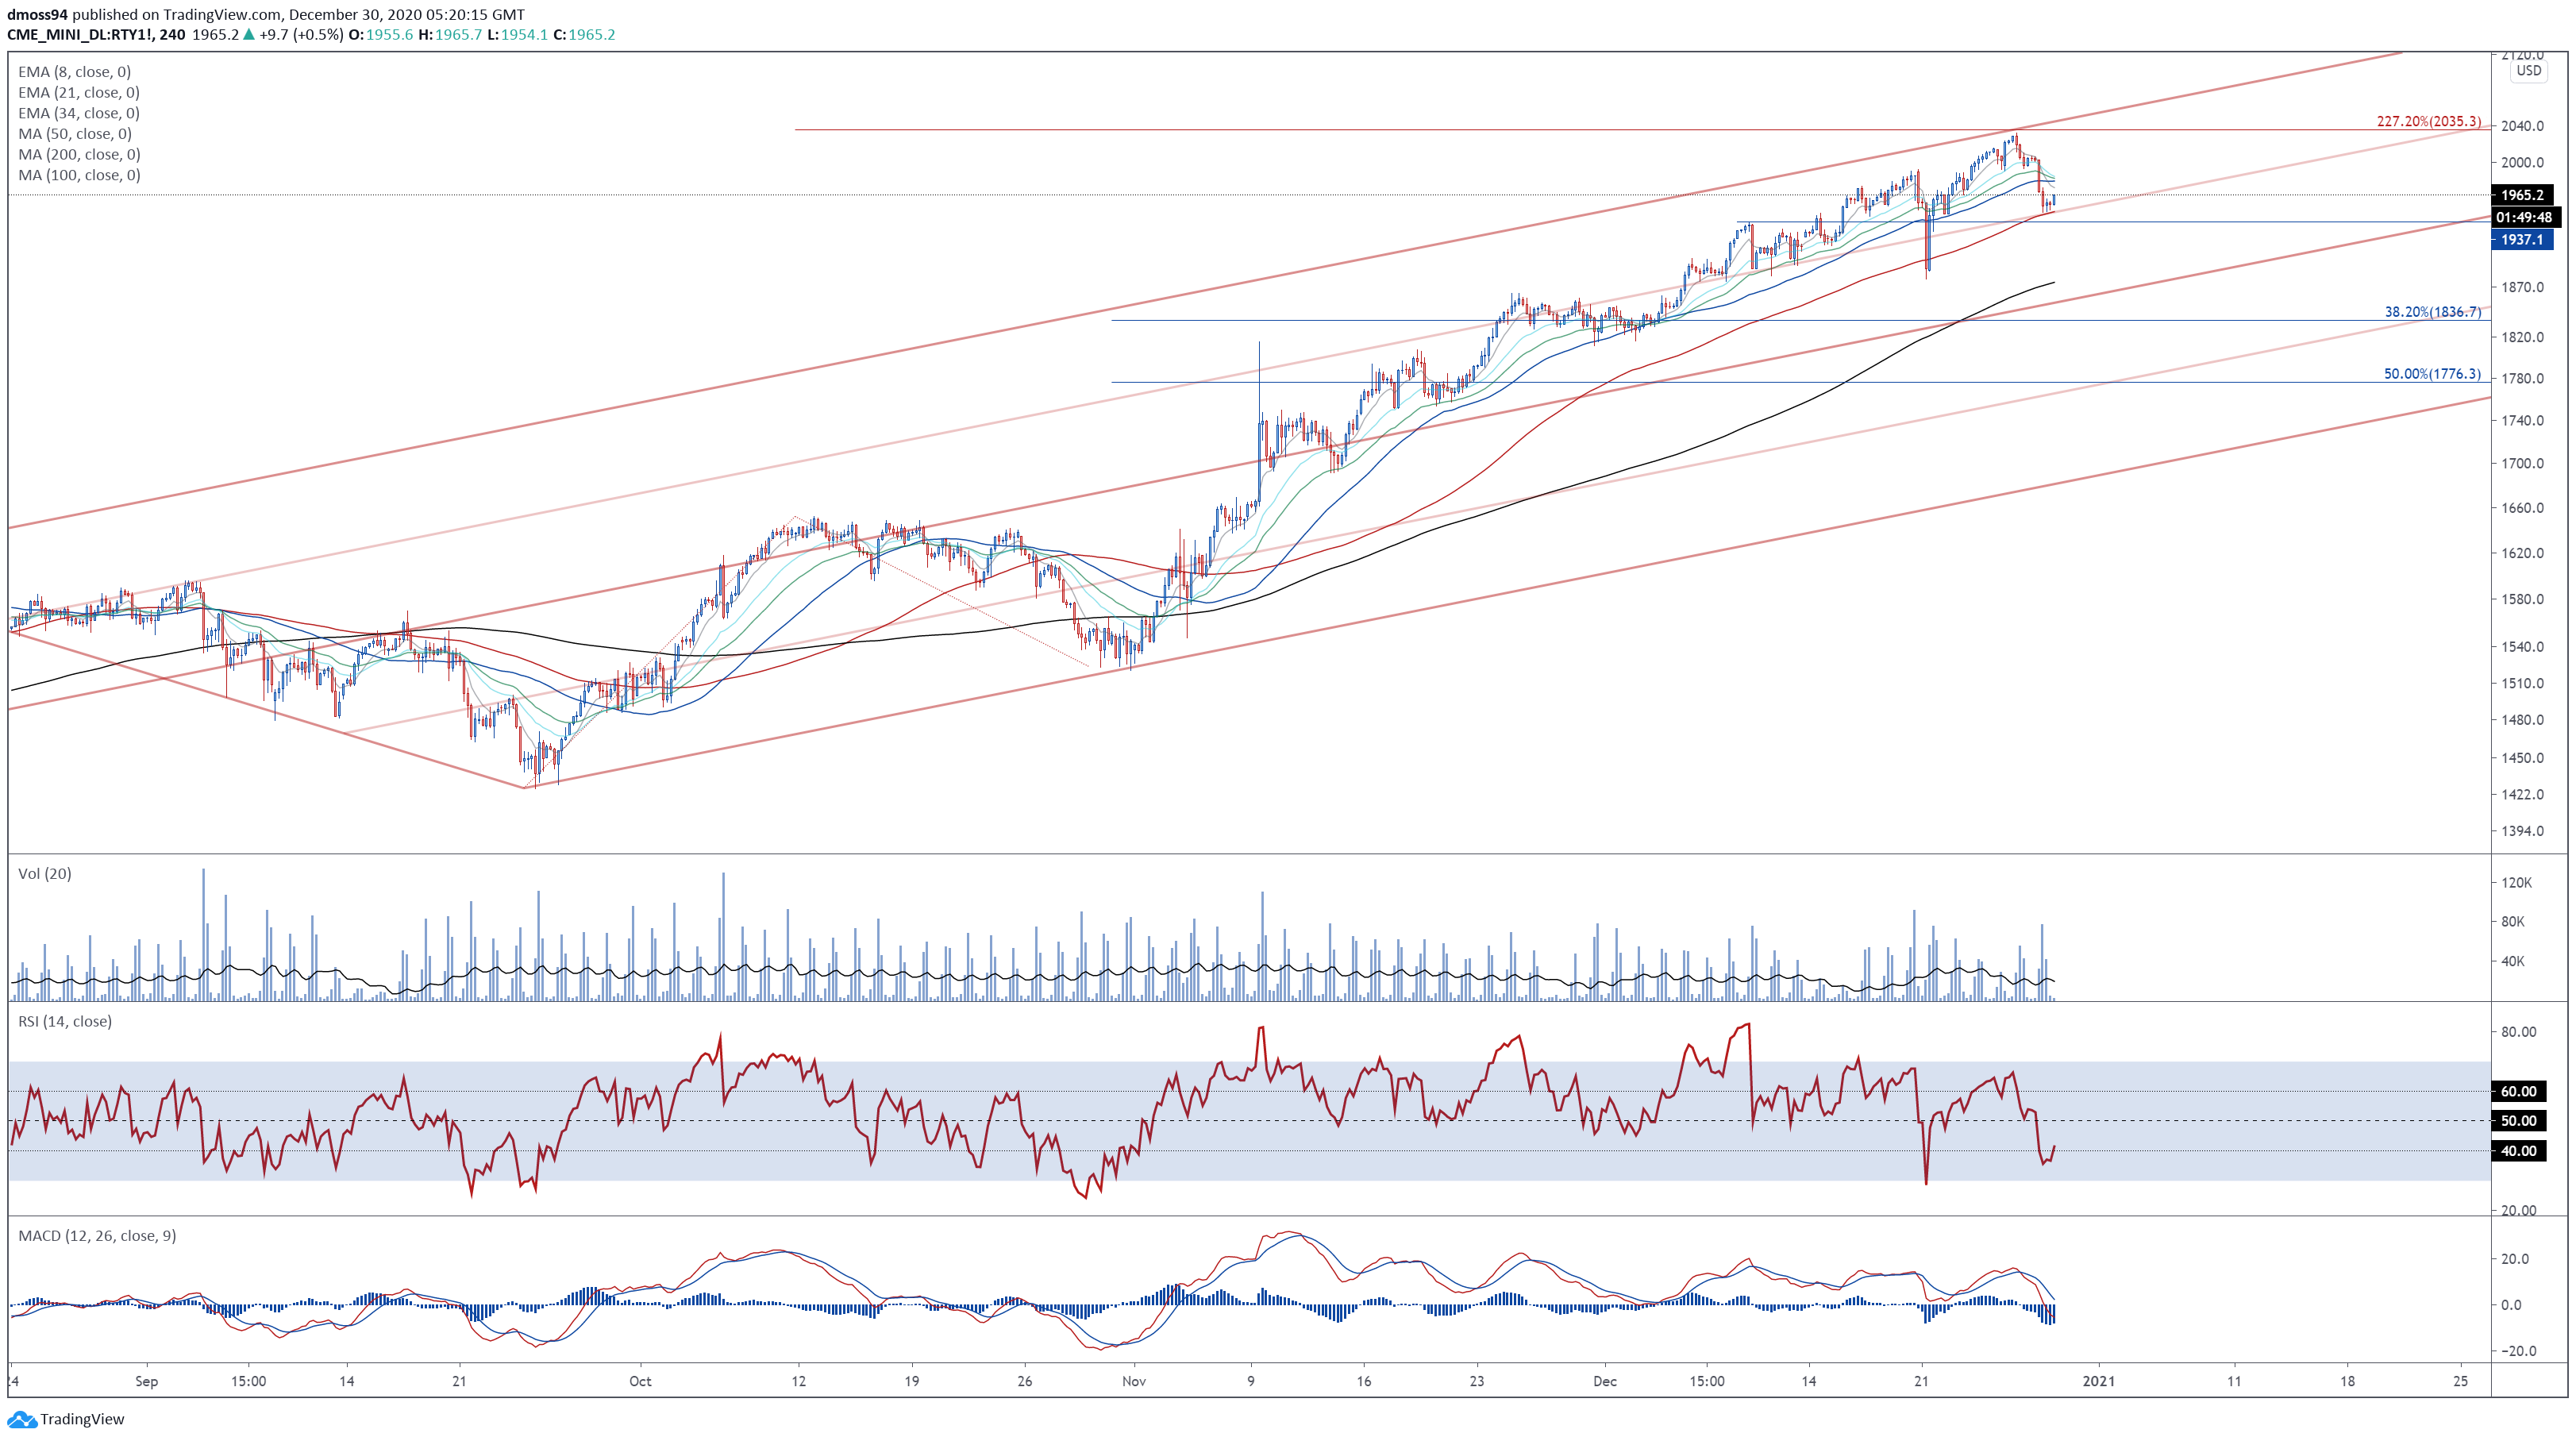
The four-hour timeframe reinforces the short-term bearish bias seen on the daily timeframe, as the Russell 2000 dives back below the trend-defining 50-MA (1980).
With the MACD indicator sliding into negative territory for the first time since November, and the slopes of the 50-MA, 100-MA and 200-MA markedly flattening, further losses look likely in the coming days.
A convincing breach of support at the 100-MA (1948) would probably nullify near-term buying pressure and clear a path to test the December 21 low (1878).
On the contrary, pushing back above the 50-MA could propel price towards key resistance at the 227.2% Fibonacci expansion level (2035).
-- Written by Daniel Moss, Analyst for DailyFX
Follow me on Twitter @DanielGMoss