
Dow Jones, Nasdaq 100, Long-Term Treasuries, TLT, Fiscal Stimulus – Talking Points:
- Equity markets traded mixed during the APAC session as investors mulled the progress of the economic rebound from the coronavirus pandemic.
- Falling long-term Treasury yields may open the door for US benchmark equity indices to continue marching higher.
The Quiz
Discover what kind of forex trader you are
Asia-Pacific Recap
Equity markets traded broadly mixed during Asia-Pacific trade, as investors mull the progress of the global economic rebound against a backdrop of rising coronavirus cases. Australia’s ASX 200 crept higher alongside Japan’s Nikkei 225, while Hong Kong’s Hang Seng Index and China’s CSI 300 slid lower as the PBoC warned lenders to maintain 2020 loan levels.
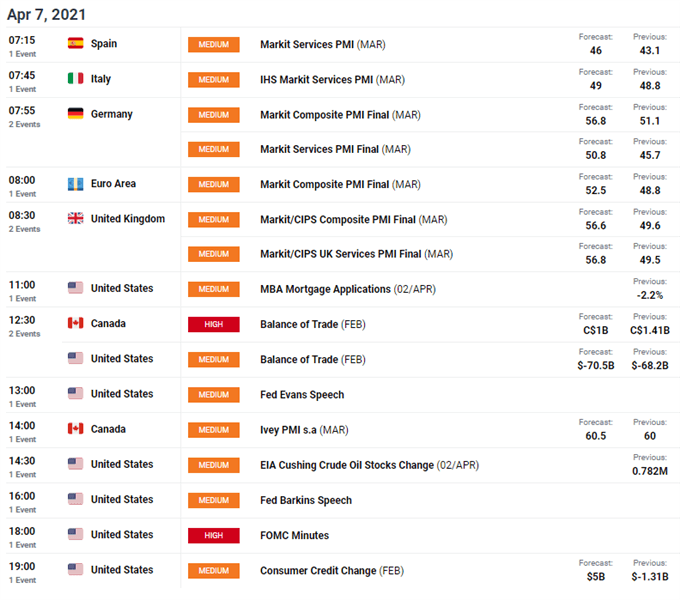
In FX markets, the risk-sensitive AUD, NZD, CAD and NOK fell against their major counterparts, while the haven-associated USD, CHF and JPY gained ground. Gold and silver prices dipped as yields on US 10-year Treasuries crept marginally higher, while crude oil prices held relatively steady. Looking ahead, a flurry of PMI figures out of Europe and the UK headline the economic docket alongside the FOMC meeting minutes.
Fiscal Stimulus Hurdles May Weigh on Treasury Yields
The prospect of substantial fiscal stimulus from the Biden administration, in combination with a rapid distribution of coronavirus vaccines, drove market expectations for inflation higher and in turn led to significant losses for longer-term Treasuries.
However, recent economic data prints and potential hurdles preventing President Biden from passing his proposed $2.25 trillion stimulus package suggest that inflationary pressure may not be as intense as previously thought. Indeed, although the US added just shy of a million jobs in March, average hourly earnings decreased by 0.1% (est. 0.1%).
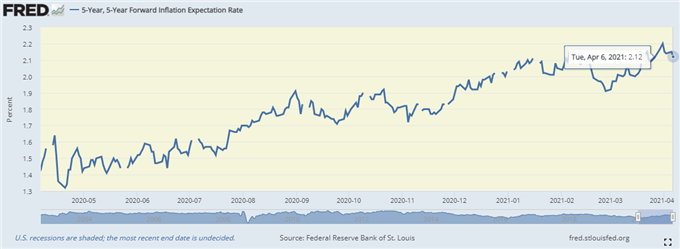
5-year forward inflation expectations have also drifted 8 basis points lower since the start of month, after peaking at 2.2% on March 31. With Republicans vehemently opposing the corporate taxation hikes, Democrats will likely be forced to utilize the process of reconciliation to approve legislation along party lines.
This process will ultimately limit the measures that can be passed, as they must have a direct impact on the federal budget. Moreover, Senate Democrat Joe Manchin of West Virginia has vehemently stated that “as the bill exists today it needs to be changed”, adding “this bill will not be in the same form you’ve seen it introduced or see people talking about it”.
The prospect of a smaller-than-expected fiscal stimulus package could cool concerns that a significant rise in inflation will prompt the Federal Reserve to tighten its monetary policy settings prematurely, paving the way for Treasury yields to retreat from their post-crisis highs and in turn opening the door for benchmark equity indices to continue marching higher.
iShares 20+ Year Treasury Bond ETF (TLT) Daily Chart
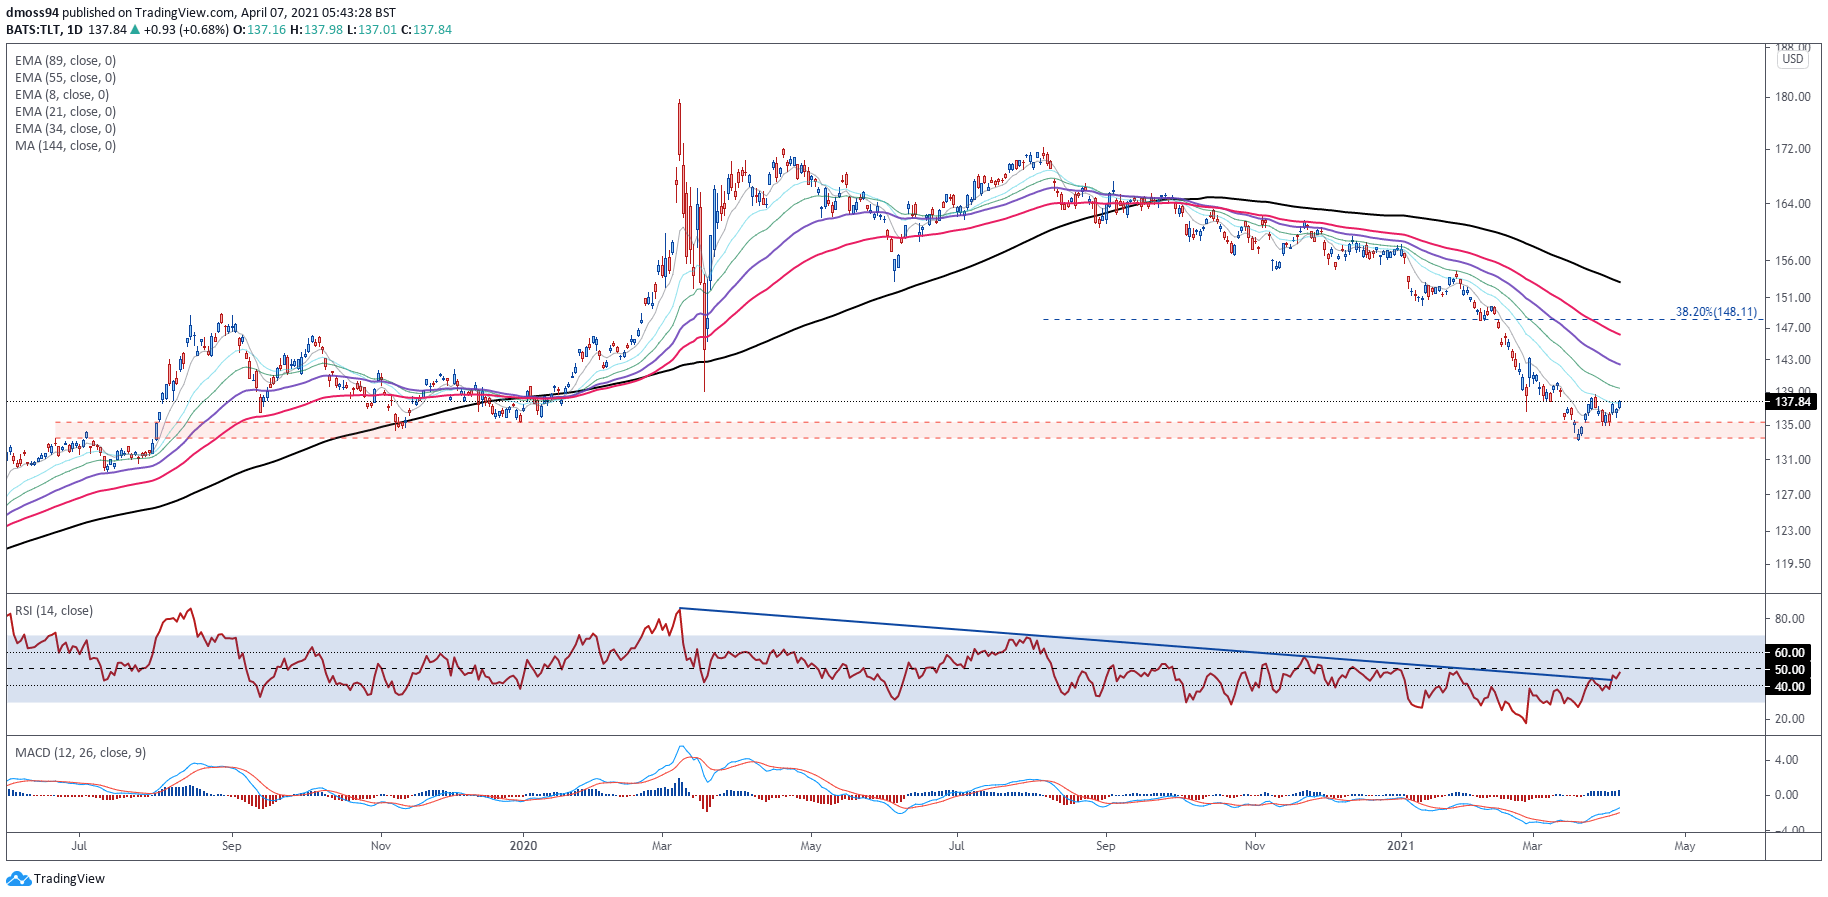
Chart prepared by Daniel Moss, created with Tradingview
In line with this thinking, longer-term Treasuries do appear poised to rebound higher in the near term, as the iShares 20+ Year Treasury Bond ETF (TLT) accelerates away from a key support range at 133.50 – 135.00.
With the RSI snapping its downtrend extending from the March 2020 extremes, and a bullish crossover taking place on the MACD indicator, a more extended recovery seems more than likely.
A daily close above the 34-EMA (139.47) probably ignites a relief-rally to challenge the trend-defining 55-EMA (142.42) and results in long-term yields retreating from yearly highs. Bond prices and yields are inversely related.
That being said, if 139.00 neutralizes buying pressure, a retest of the yearly low is certainly not out of the question, which would in turn carve a path for yields to continue gaining ground.
Dow Jones Futures Daily Chart – Rising Wedge or Bullish Continuation
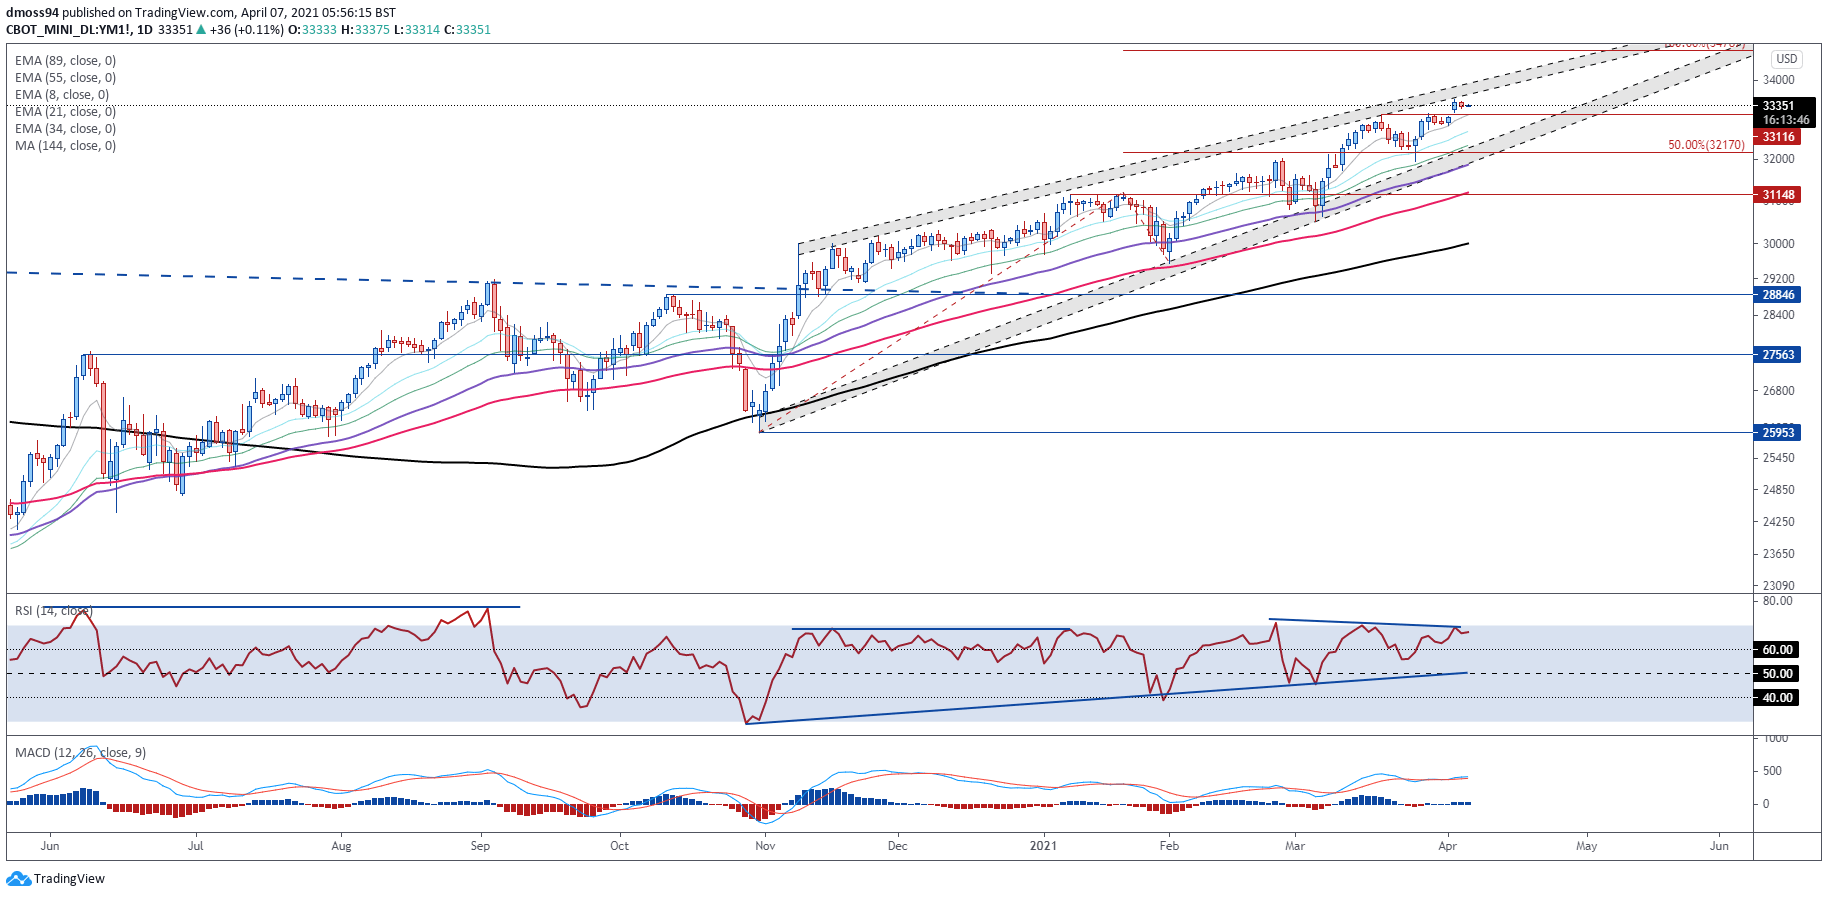
Chart prepared by Daniel Moss, created with Tradingview
The technical outlook for the Dow Jones is relatively mixed, as prices hover tentatively above key psychological resistance at 33,000.
Bearish RSI divergence, and the formation of a possible Rising Wedge reversal pattern, suggest that a downside break could be on the cards.
However, bullish moving average stacking, in tandem with both the RSI and MACD indicators tracking firmly above their respective neutral midpoints, the path of least resistance seems skewed to the topside.
A daily close above the April 5 high (33504) is needed to signal the resumption of the primary uptrend and bring the landmark 34,000 mark.
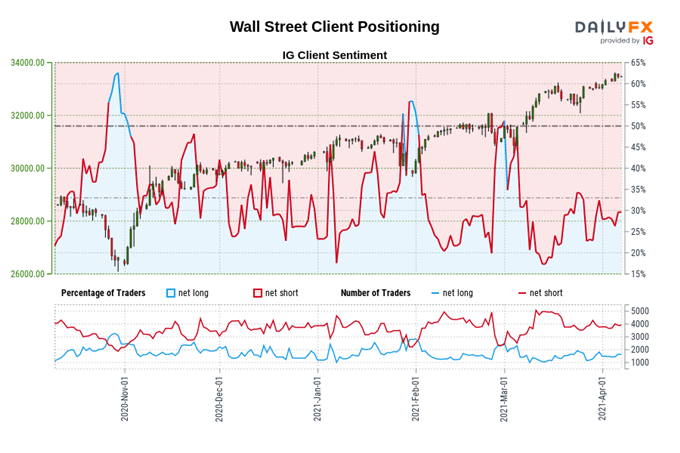
The IG Client Sentiment Reportshows 29.71% of traders are net-long with the ratio of traders short to long at 2.37 to 1. The number of traders net-long is 24.04% higher than yesterday and 3.98% higher from last week, while the number of traders net-short is 3.08% lower than yesterday and 0.52% higher from last week.
We typically take a contrarian view to crowd sentiment, and the fact traders are net-short suggests Wall Street prices may continue to rise.
Yet traders are less net-short than yesterday and compared with last week. Recent changes in sentiment warn that the current Wall Street price trend may soon reverse lower despite the fact traders remain net-short.
Nasdaq 100 Futures Daily Chart – Yearly High in Focus

Chart prepared by Daniel Moss, created with Tradingview
The tech-heavy Nasdaq 100 appears poised to challenge the record high set in February of this year, as prices crash through key resistance at the February 25 high (13354).
With the RSI jumping back above 60, and the MACD rising into positive territory for the first time in six weeks, a more extended topside push looks likely.
Nevertheless, a short-term throwback to former resistance-turned-support at 13,350 may precede a push to challenge the record high, with a convincing break above needed to bring the landmark 14,000 mark into the crosshairs.
-- Written by Daniel Moss, Analyst for DailyFX
Follow me on Twitter @DanielGMoss