

Crude Oil Price Forecast Talking Points:
- WTI Crude Oil fell to a fresh four-month-low this morning.
- This fresh low broke through range support that’s held for the better part of two months.
- The sell-off has so far found support at a key Fibonacci level plotted around 35.66.
- The analysis contained in article relies on price action and chart formations. To learn more about price action or chart patterns, check out our DailyFX Education section.
Crude Oil Sell-Off Breaks Range to Set Fresh Four-Month-Lows
The earlier-year break below the zero level looms large in Crude Oil prices, but, for the past two months, WTI has been in a fairly consistent range with about $4 of deviation from support to resistance. The support-side of that range was violated earlier this morning as sellers pushed prices down to a fresh four-month-low, eventually finding some support at a key Fibonacci level.
{{GUIDE| OILTRADINGFUND}}
The price of 35.66 is the 38.2% retracement of the 2020 major move, as taken from the CL2 chart. Given the outlier event of prices breaking below-zero in April, many crude oil charts show obfuscated long-term technical criteria. But, by looking at CL2, which is the next month’s contract rather than the current months, we can strip out that outlier event to, ideally, get a more clear look at what today’s moves mean in terms of the bigger picture. Normally, I’d be hesitant to embark on such retrofitting but, given the outlier event as well as the 50% level from that same Fibonacci study helping to set recent range resistance, I’m a bit more open to following CL2 than I might be otherwise.
Crude Oil Daily Price Chart (CL2)
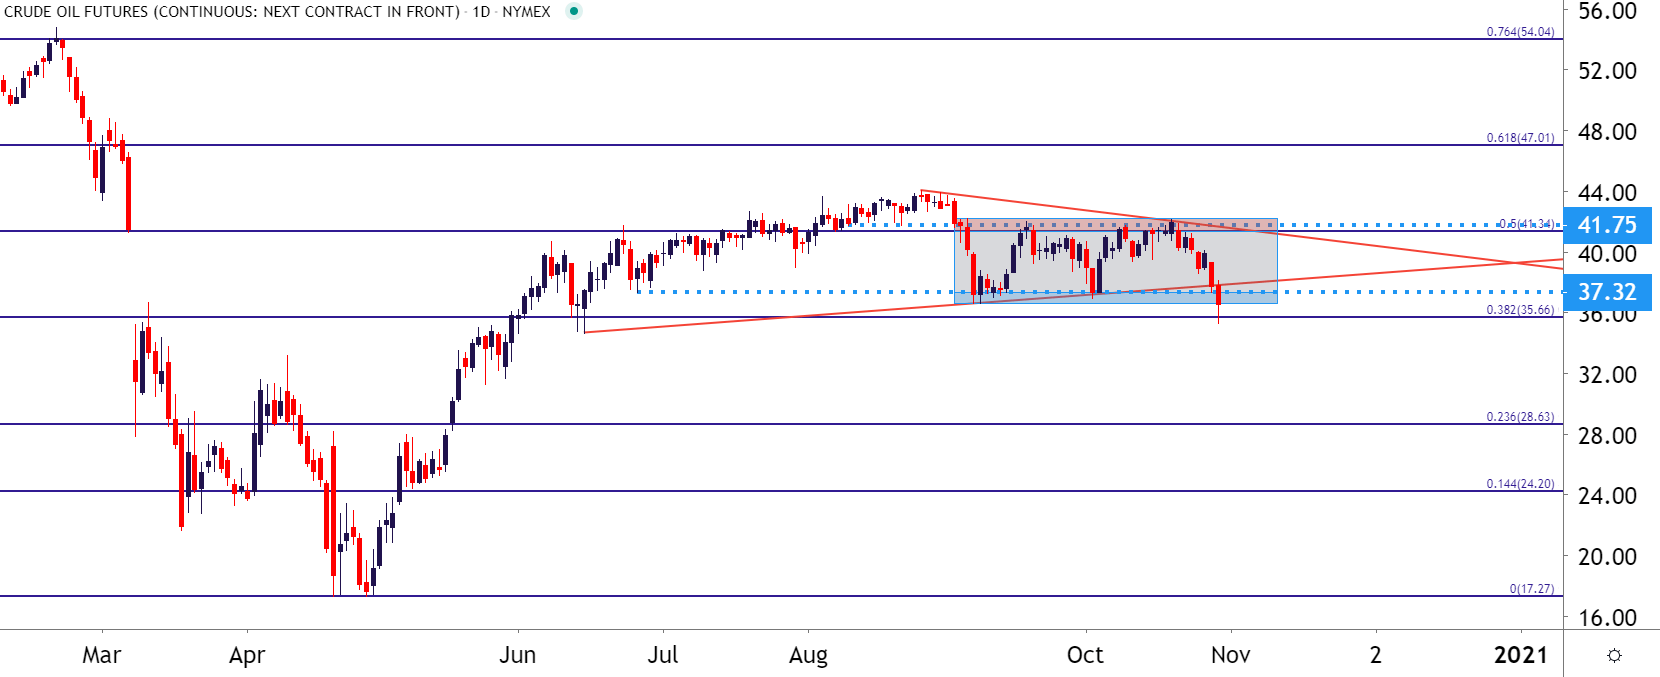
Chart prepared by James Stanley; CL2 on Tradingview
Taking a shorter-term look at the matter, and Crude Oil prices are bouncing from that Fibonacci support into the prior zone of range support. The prior swing-low that was set yesterday, at around 37.32, could open the door for resistance plays for those looking to trade short-side continuation scenarios. Also of interest for resistance potential inside that zone of prior range support – the October 2nd low at 36.93 could also provide some usable context for bears.
WTI Crude Oil Four-Hour Price Chart
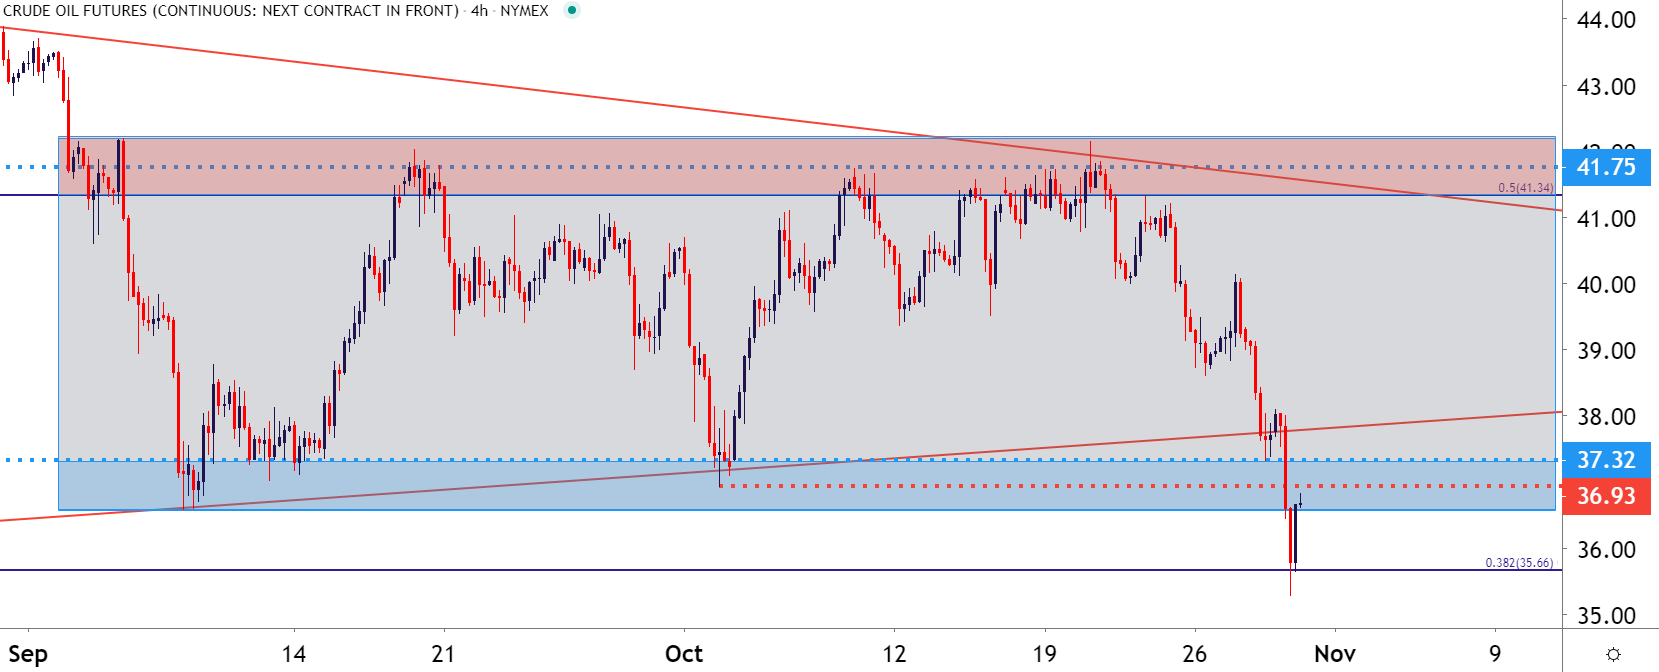
Chart prepared by James Stanley; CL2 on Tradingview
--- Written by James Stanley, Strategist for DailyFX.com
Contact and follow James on Twitter: @JStanleyFX