

Canadian Dollar Talking Points:
- USD/CAD broke out in a big way to start the week, setting a fresh five month high.
- The past two days, however, have seen the entirety of that breakout erased with USD/CAD returning to a key zone of support/resistance.
- The analysis contained in article relies on price action and chart formations. To learn more about price action or chart patterns, check out our DailyFX Education section.
It’s been a feast or famine week so far for USD/CAD bulls, as the pair started out with a big breakout beyond a key zone of resistance, only for sellers to jump in and re-take control of the matter.
I had last looked into the pair ahead of the monthly open, and at the time USD/CAD had just put in a support test at another key area on the chart. Resistance was looming overhead, spanning from the 1.2500 psychological level up to the 1.2622 Fibonacci level and hadn’t yet come back into play, as buyers had shied away from a 1.2500 re-test ahead of the July open.
I looked at the pair again around last week’s open, highlighting this as an ‘amplified usd scenario’ that could see considerable strength should USD bulls continue to push, which is precisely what happened leading into this week and that Monday breakout.
USD/CAD Two-Hour Price Chart
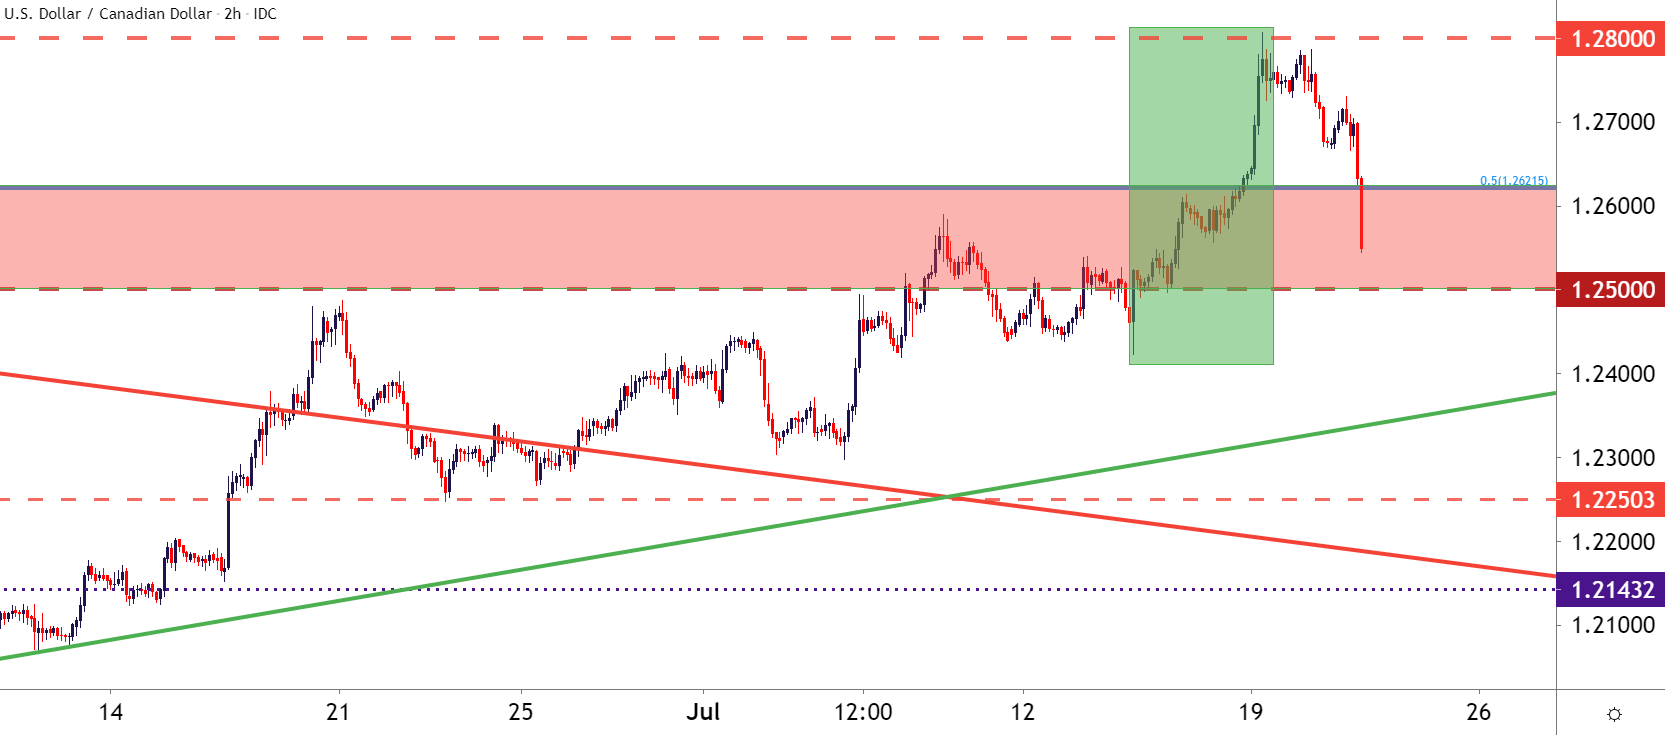
Chart prepared by James Stanley; USDCAD on Tradingview
Taking a step back on the chart to put this recent breakout and reversal into perspective, and matters seem a bit more calm, at least with some context. This can actually keep the door open for USD bulls, as prices are essentially pulling back for a support test in that same really big zone of 1.2500-1.2622. This zone started to come into play as support ahead of the 2021 open, and soon became resistance in April before prices broke down. It returned as in July, albeit briefly, and with prices quickly returning to this area – it looks like it could be a support test.
Bulls holding a higher-low above last week’s swing low of 1.2426 can keep the door open for bullish long-term strategies in USD/CAD.
USD/CAD Daily Price Chart: Return to Support (from Prior Resistance)
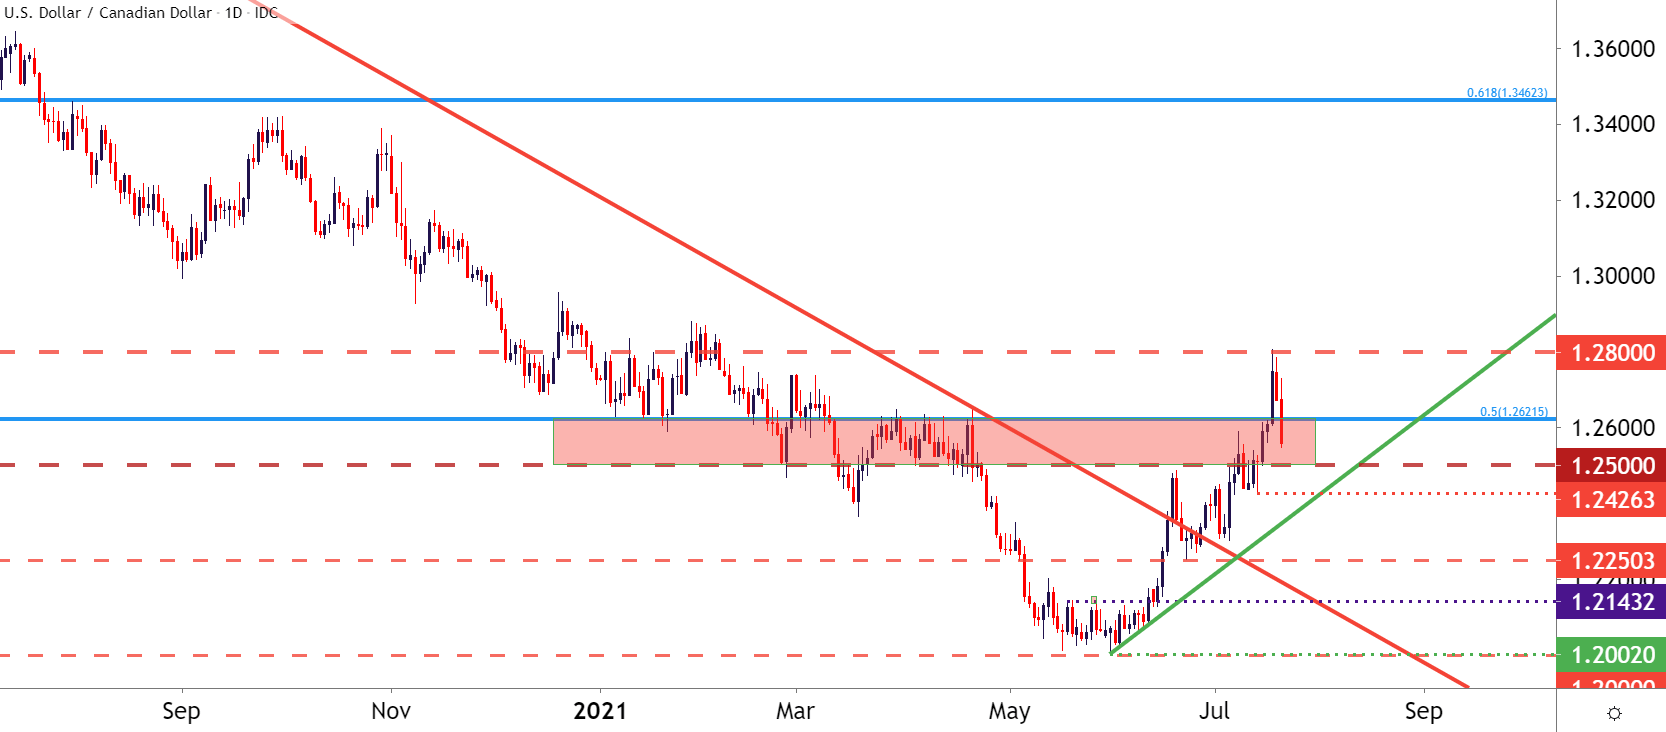
Chart prepared by James Stanley; USDCAD on Tradingview
--- Written by James Stanley, Strategist for DailyFX.com
Contact and follow James on Twitter: @JStanleyFX