

Canadian Dollar, Crude Oil, Inflation, USD/CAD, CAD/JPY – Talking Points:
- Equity markets slid lower during APAC trade as investors mulled the impact of the recent climb in bond yields.
- Inflation figures for January may dictate the near-term trajectory of the Canadian Dollar.
- USD/CAD attempting to rebound from key support.
- CAD/JPY’s extended uptrend at risk of a short-term pullback.
Asia-Pacific Recap
Equity markets slipped lower during Asia-Pacific trade as investors mulled the impact of climbing bond yields on asset prices. Australia’s ASX 200 dropped 0.46% and Japan’s Nikkei 225 slipped 0.58%. Hong Kong’s Hang Seng Index extended its 5-day rally, surging 1.13%.
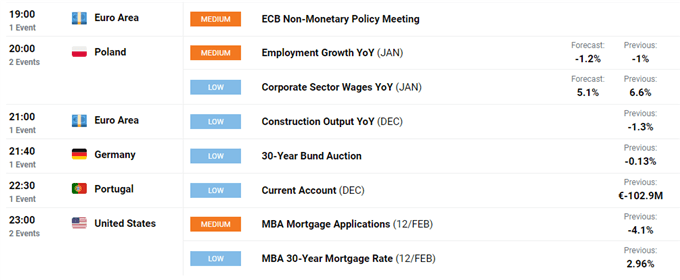
In FX markets, the haven-associated USD, JPY and CHF gained ground, while the cyclically-sensitive NZD and NOK largely underperformed their major counterparts. Gold prices drifted lower as US 10-year Treasury yields held above 1.3%. Looking ahead, Euro-area construction output for December and US mortgage applications headline a rather light economic docket.
January Inflation Print in Focus for CAD
The Canadian Dollar has performed strongly against its haven-associated counterparts in February, climbing over 2.2% and 1.8% higher against the Japanese Yen and US Dollar respectively. This strength comes on the back of rallying oil prices, with WTI crude surging above $60 a barrel for the first time since January 2020.
Oil prices have gained substantial ground as freezing temperatures in the US result in a 3.5 million barrels a day reduction in overall output. The prospect of additional fiscal stimulus from the Biden administration has also buoyed the Loonie against its North American counterpart, with the House aiming to vote on the President’s $1.9 trillion coronavirus-relief package on February 26.
Locally, investors appeared to have looked past January’s disappointing jobs figures, with the unemployment rate unexpectedly climbing to 9.4% (exp. 8.9%) and the participation rate dropping to 64.7% (exp. 64.9%). Indeed, with Canadian coronavirus infections dropping dramatically, its seems reopening hopes are buoying the local currency.

CAD/JPY, CAD/USD, WTI Crude Oil daily chart created using Tradingview
The 7-day moving average tracking cases has fallen to just under 3,000 after peaking at 8,885 on January 9. Moreover, surprisingly hawkish commentary out of the Bank of Canada could underpin CAD, with the central bank hinting at the possibility of pulling back on some of its supportive measures as the local economy continues to recover.
Governor Tiff Macklem stated after the BoC’s recent monetary policy meeting that “if the economy and inflation play out broadly in line or stronger than we projected, then the amount of quantitative easing (QE) stimulus needed will diminish over time”.
With that in mind, upcoming inflation figures for January will be intently scrutinized by investors. A larger-than-expected rise in consumer price growth likely intensifies tapering bets and in turn puts a premium on CAD against USD and JPY.
USD/CAD Daily Chart – Short-Term Rebound on the Cards
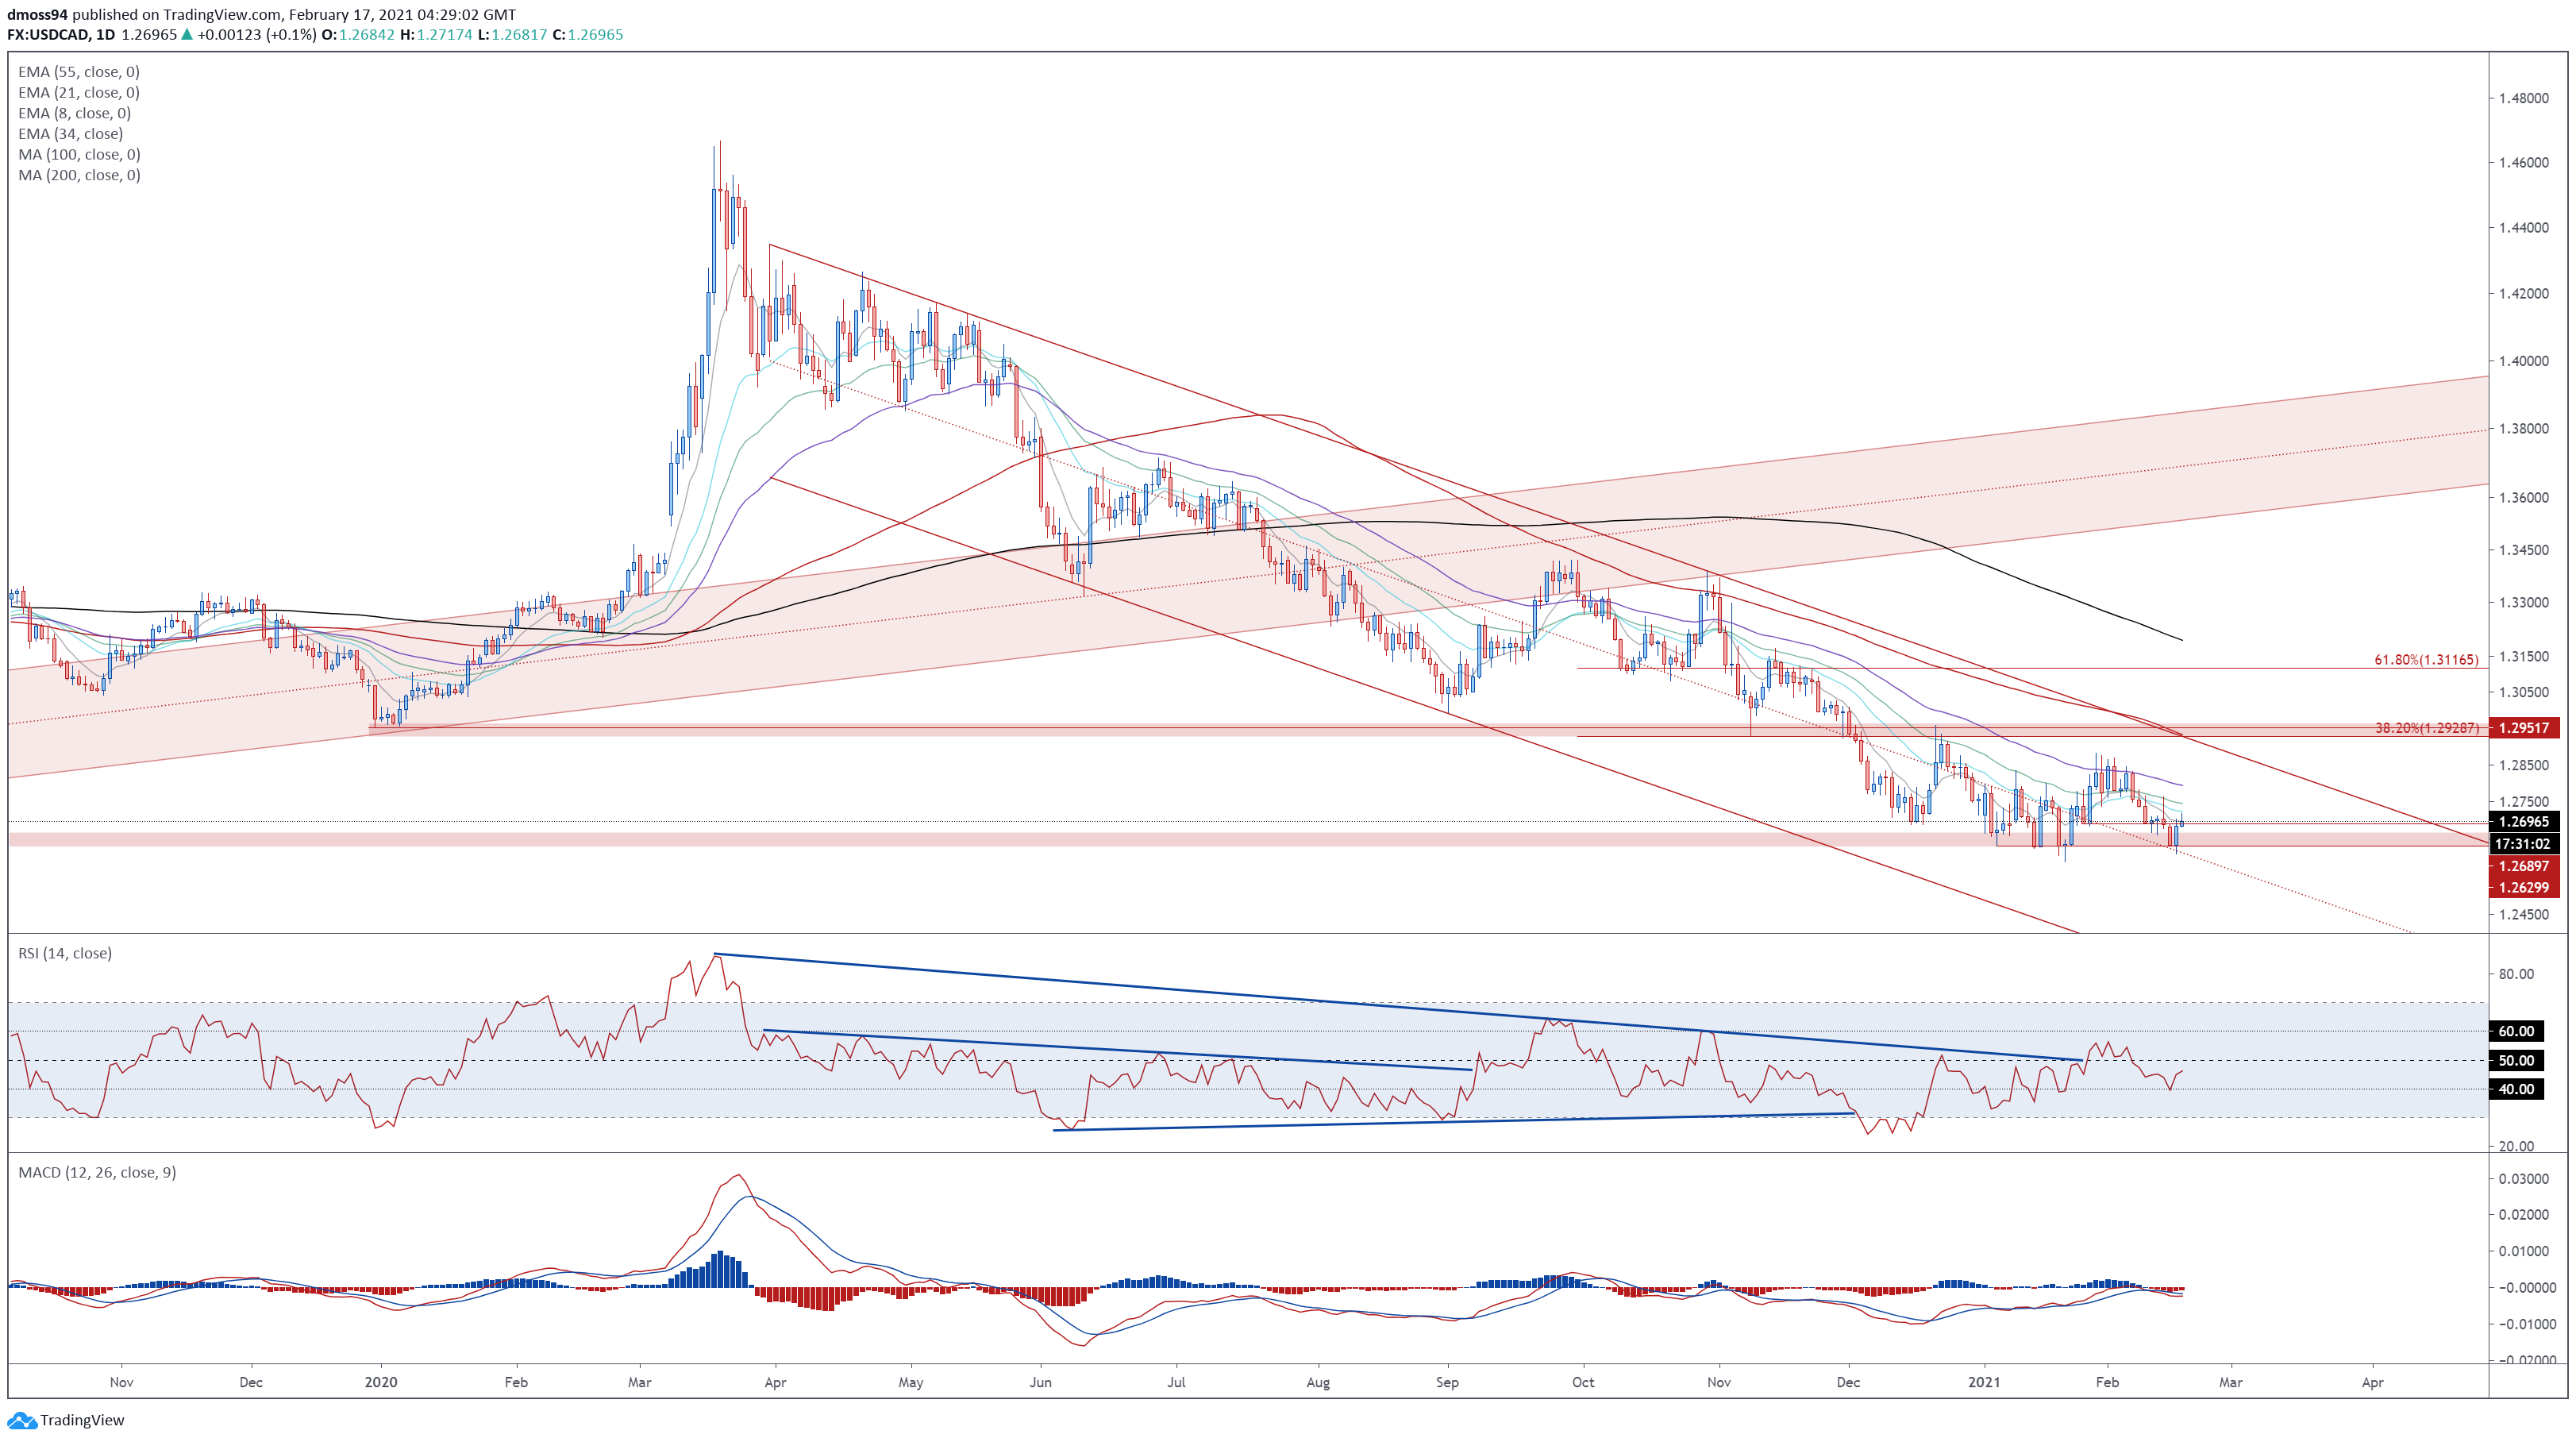
USD/CAD daily chart created using Tradingview
From a technical perspective, the long-term outlook for USD/CAD rates remains skewed to the downside, as price continues to track within the confines of a Descending Channel and comfortably below the trend-defining 55-day exponential moving average (1.2795).
However, the formation of a bullish Outside Day candle just above key support at the yearly low (1.2589), in combination with the RSI bouncing away from 40, suggests that a short-term rebound higher could be on the cards.
A daily close above 1.2700 could pave the way for buyers to challenge the 55-EMA, with a convincing breach needed to bring channel resistance and the 38.2% Fibonacci (1.2952) into focus.
That being said, an extended climb higher seems relatively unlikely, given price is travelling firmly below all 6 moving averages, and the MACD indicator remains below its neutral midpoint.
Therefore, failing to clear 1.2700 probably results in the exchange rate sliding back towards the monthly low (1.2610). A daily close below that likely signalling the resumption of the primary downtrend and clearing a path to challenge the April 2018 low (1.2527).
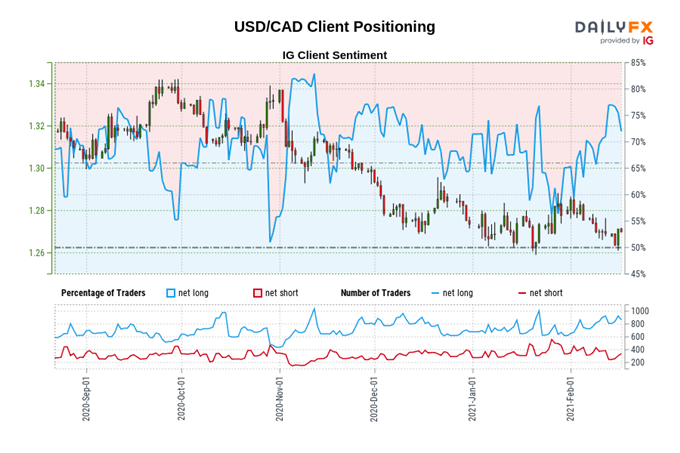
The IG Client Sentiment Report shows 70.88% of traders are net-long with the ratio of traders long to short at 2.43 to 1. The number of traders net-long is 0.23% higher than yesterday and 0.23% lower from last week, while the number of traders net-short is 22.68% higher than yesterday and 6.05% lower from last week.
We typically take a contrarian view to crowd sentiment, and the fact traders are net-long suggests USD/CAD prices may continue to fall.
Positioning is less net-long than yesterday but more net-long from last week. The combination of current sentiment and recent changes gives us a further mixed USD/CAD trading bias.
CAD/JPY Daily Chart – RSI Sell Signal Hints at Potential Pullback
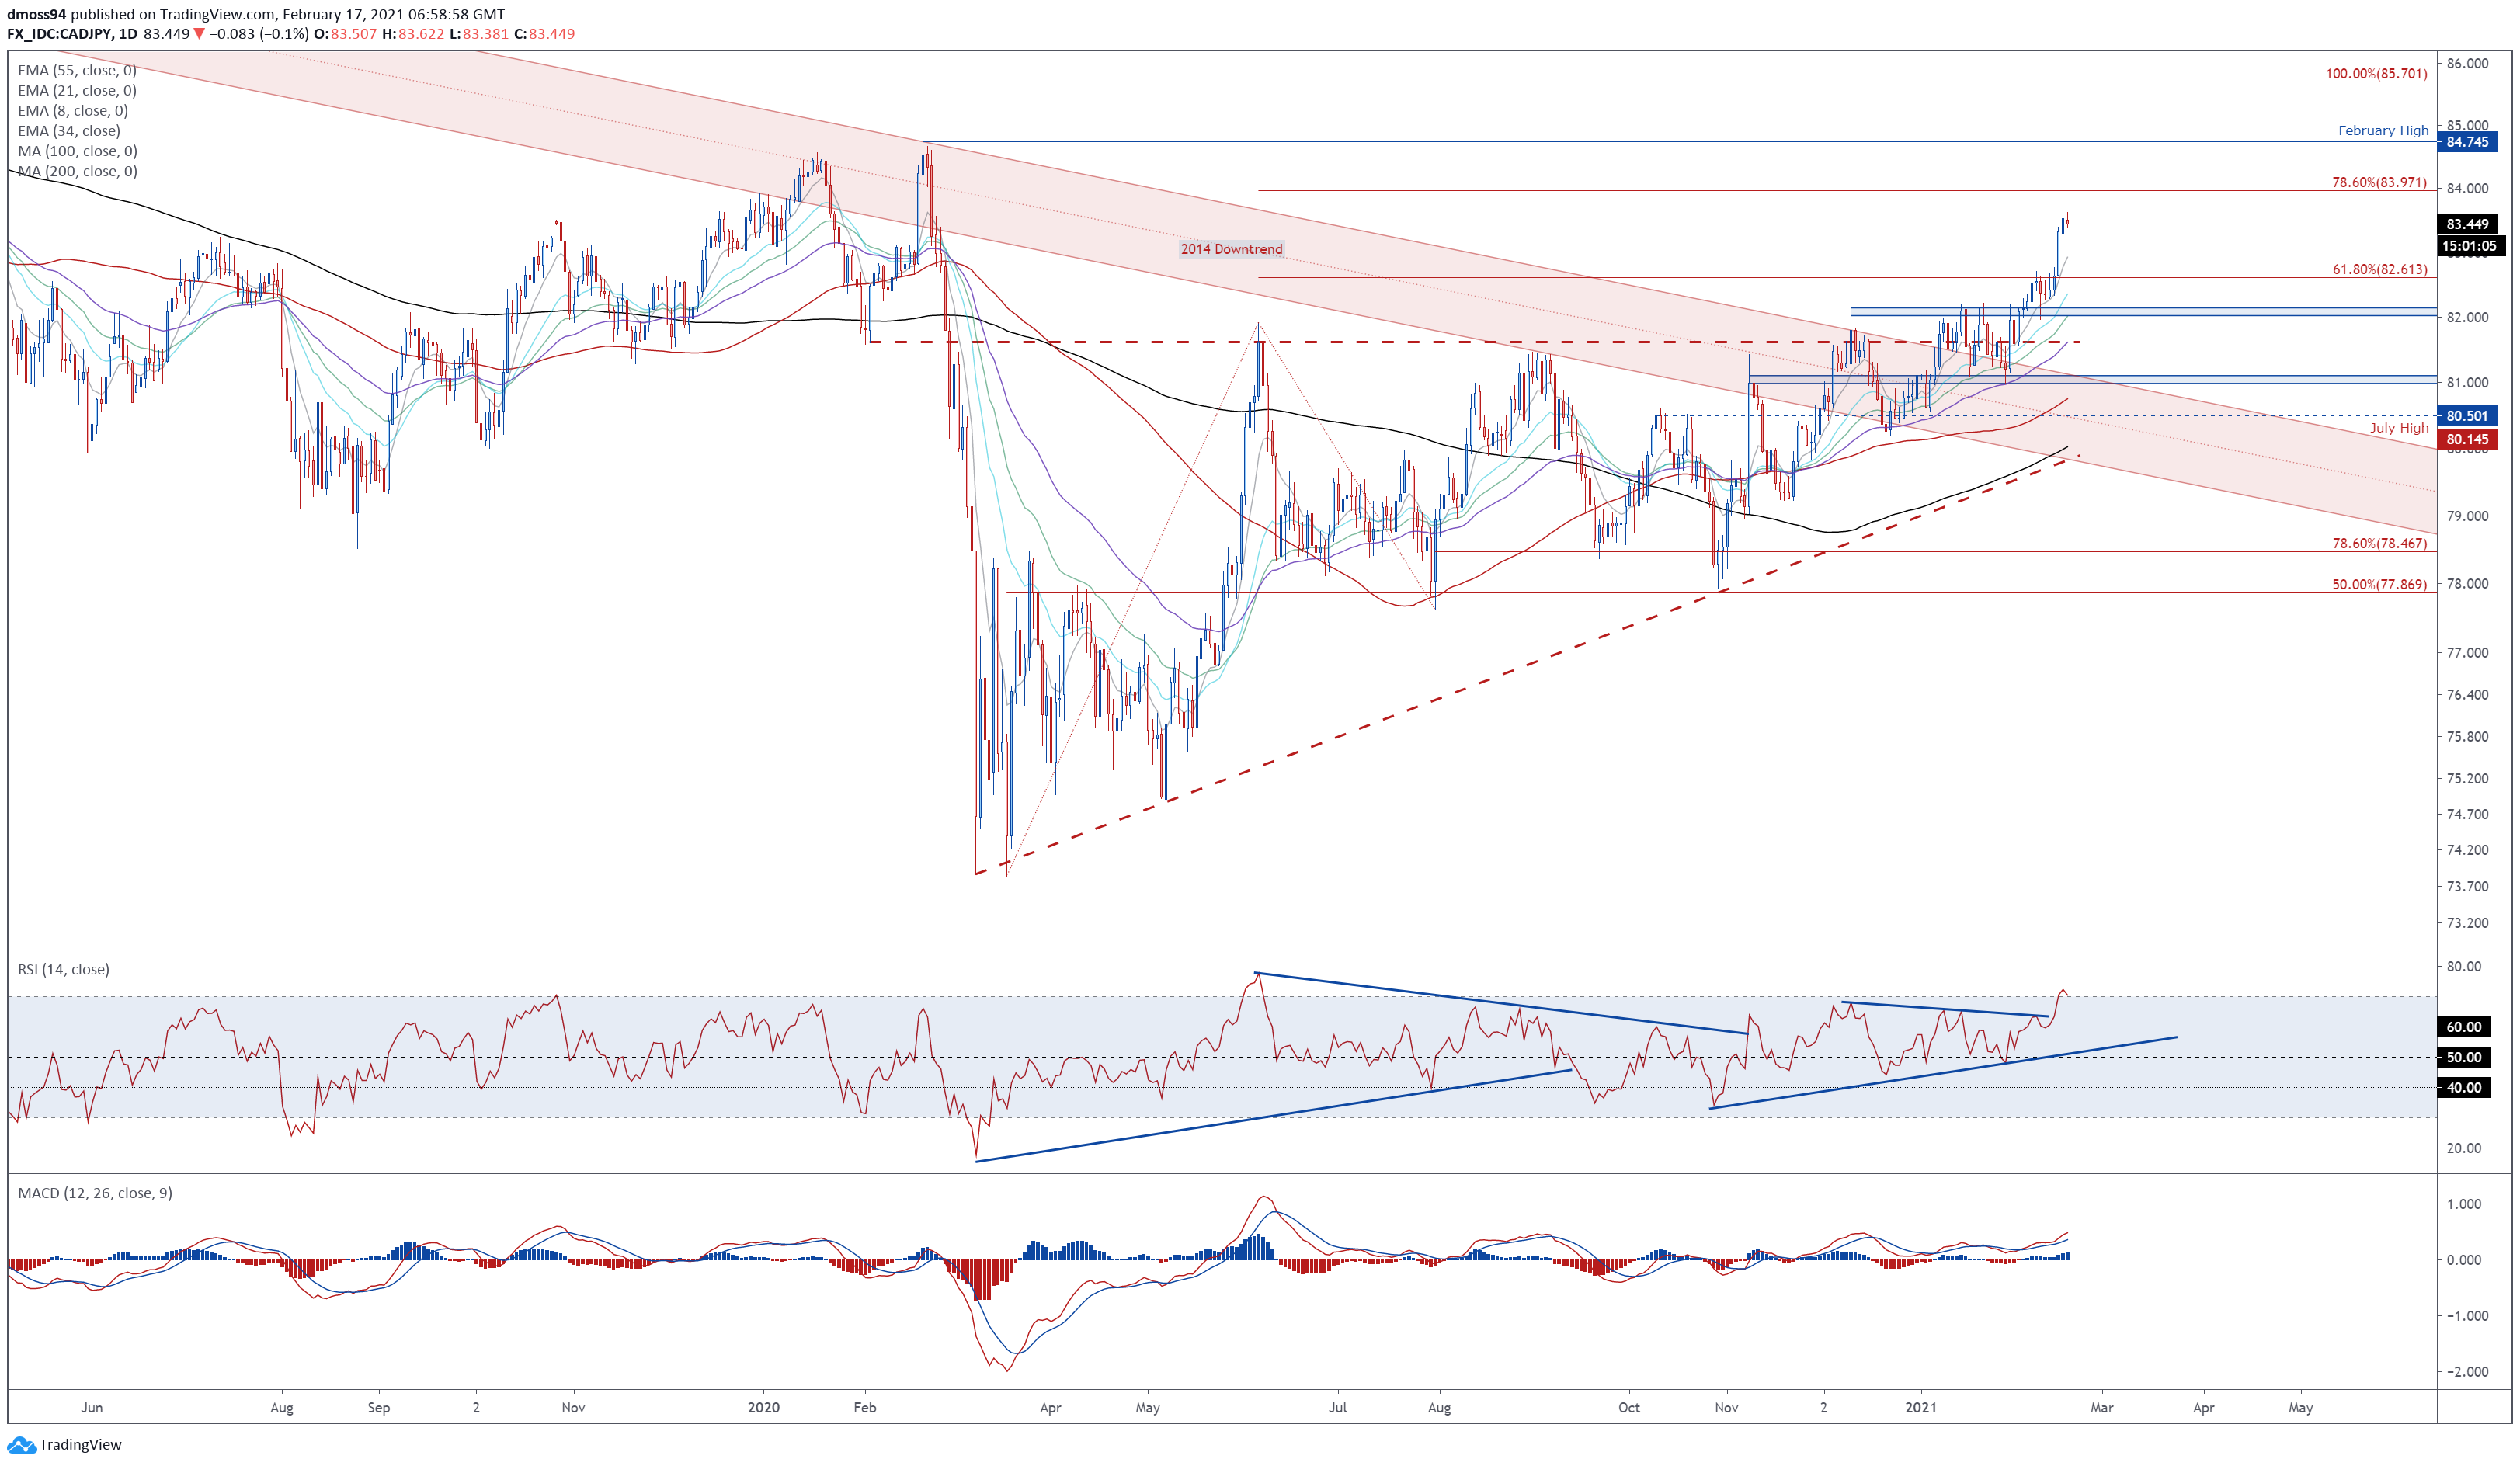
CAD/JPY daily chart created using Tradingview
CAD/JPY’s long-term outlook continues to favour the upside, as prices surge above key psychological resistance at 83.00 and the RSI registers its first overbought readings since May of 2020.
Indeed, bullish MA stacking, combined with the MACD aiming higher, suggests that further gains are in the offing.
However, the recent topside push seems somewhat extended, which could open the door for a counter-trend pullback to the 8-EMA (82.92). Breaching that may trigger a more extended pullback towards former resistance-turned-support at the 61.8% Fibonacci (82.61).
Conversely, a daily close above the February 16 high (83.75) would likely signal the resumption of the primary uptrend and bring a cluster of resistance levels at the 78.6% Fibonacci (83.9) and 2020 high (84.75) into focus.
-- Written by Daniel Moss, Analyst for DailyFX
Follow me on Twitter @DanielGMoss