USD/MYR, USD/SGD, USD/PHP, USD/IDR - Talking Points
- USD/MYR may bounce on support as USD/SGD breakout struggles
- USD/PHP prices reinforce psychological floor as resistance nears
- USD/IDR descends through rising trend line, opening door to fall?
Malaysian Ringgit Technical Outlook
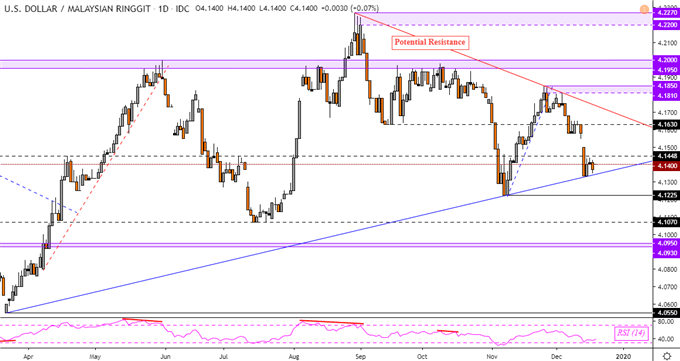
The Malaysian Ringgit has extended its advance against the US Dollar since prices topped at the beginning of this month. USD/MYR has since paused its descent after failing to breach key rising support from March – blue line on the chart below. That may result in a bounce towards resistance at 4.1630. Otherwise, a daily close under the trend line exposes 4.1225 and then lows from July.
To stay updated on fundamental developments for ASEAN currencies, follow me on Twitter here @ddubrovskyFX
USD/MYR Daily Chart

USD/MYR Chart Created in TradingView
Singapore Dollar Technical Outlook
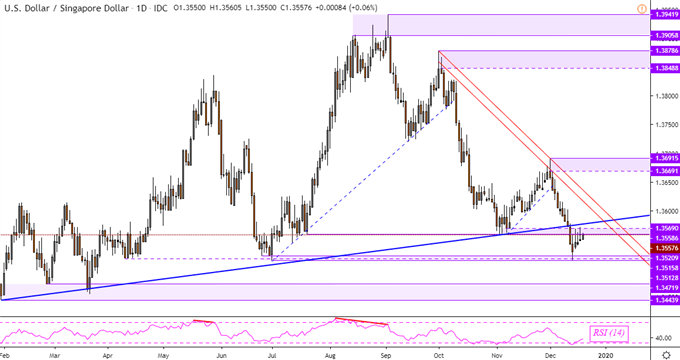
Despite a break under the rising trend line from January, the Singapore Dollar has struggled to make further progress against its US counterpart. USD/SGD bounced on the psychological barrier between 1.3512 and 1.3520, reinforcing it as key support. A daily close above resistance – a range between 1.3558 and 1.3569 – opens the door to retesting the rising trend line as prices aim towards highs from earlier this month.
Learn more about how the MAS conducts monetary policy and what matters for the Singapore Dollar!
USD/SGD Daily Chart

USD/SGD Chart Created in TradingView
Philippine Peso Technical Outlook
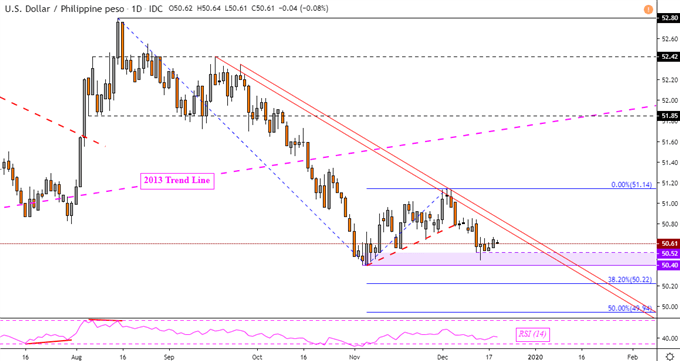
USD/PHP could be on the verge of bottoming after prices were unable to push through key support which is a range between 50.40 and 50.52. That could translate into a bounce towards descending resistance from September – red lines on the chart below. Clearing this technical boundary may result in a depreciation of the Philippine Peso as the currency pair aims for the current December high at 51.14.
USD/PHP Daily Chart

USD/PHP Chart Created in TradingView
Indonesian Rupiah Technical Outlook
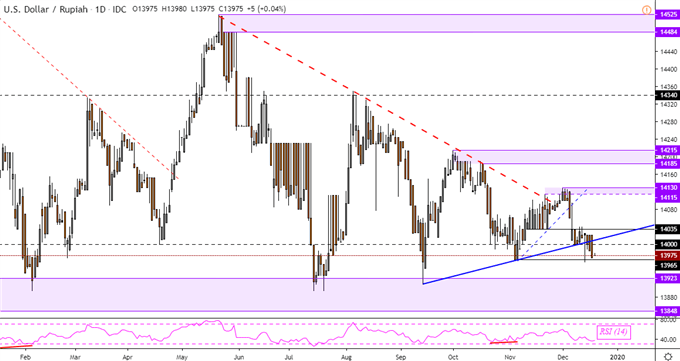
The Indonesian Rupiah has taken out a near-term rising support line from September against the US Dollar. That has pushed USD/IDR to retesting the November low at 13965 where prices have since struggled to breach it. A daily close lower opens the door to testing the September low and the key psychological barrier between 13848 and 1392. The latter is a floor that has its beginnings from June 2018.
USD/IDR Daily Chart

USD/IDR Chart Created in TradingView
--- Written by Daniel Dubrovsky, Currency Analyst for DailyFX.com
To contact Daniel, use the comments section below or @ddubrovskyFX on Twitter


