

USD/JPY and USD/CHF Outlook
- US Dollar price against Swiss Franc and Japanese Yen Charts and Analysis
Did you check our latest forecasts on USD and EUR and Gold? Find out more for free from our Q3 forecasts for commodities and main currencies
USD/CHF, USD/JPY – Price Action
On Wednesday, USD/CHF rallied towards 0.9984 – its highest level in three months. The price found resistance at the exact same level in the following day then declined below 0.9900 handle. Similarly, USD/JPY this week printed its highest level in seven weeks at 108.48, then slipped back below 108.00 handle.
The Relative Strength Index (RSI) rose to 64 on both pairs then declined to 58, indicating to a slowing bullish momentum.
Just getting started? See our Beginners’ Guide for FX traders
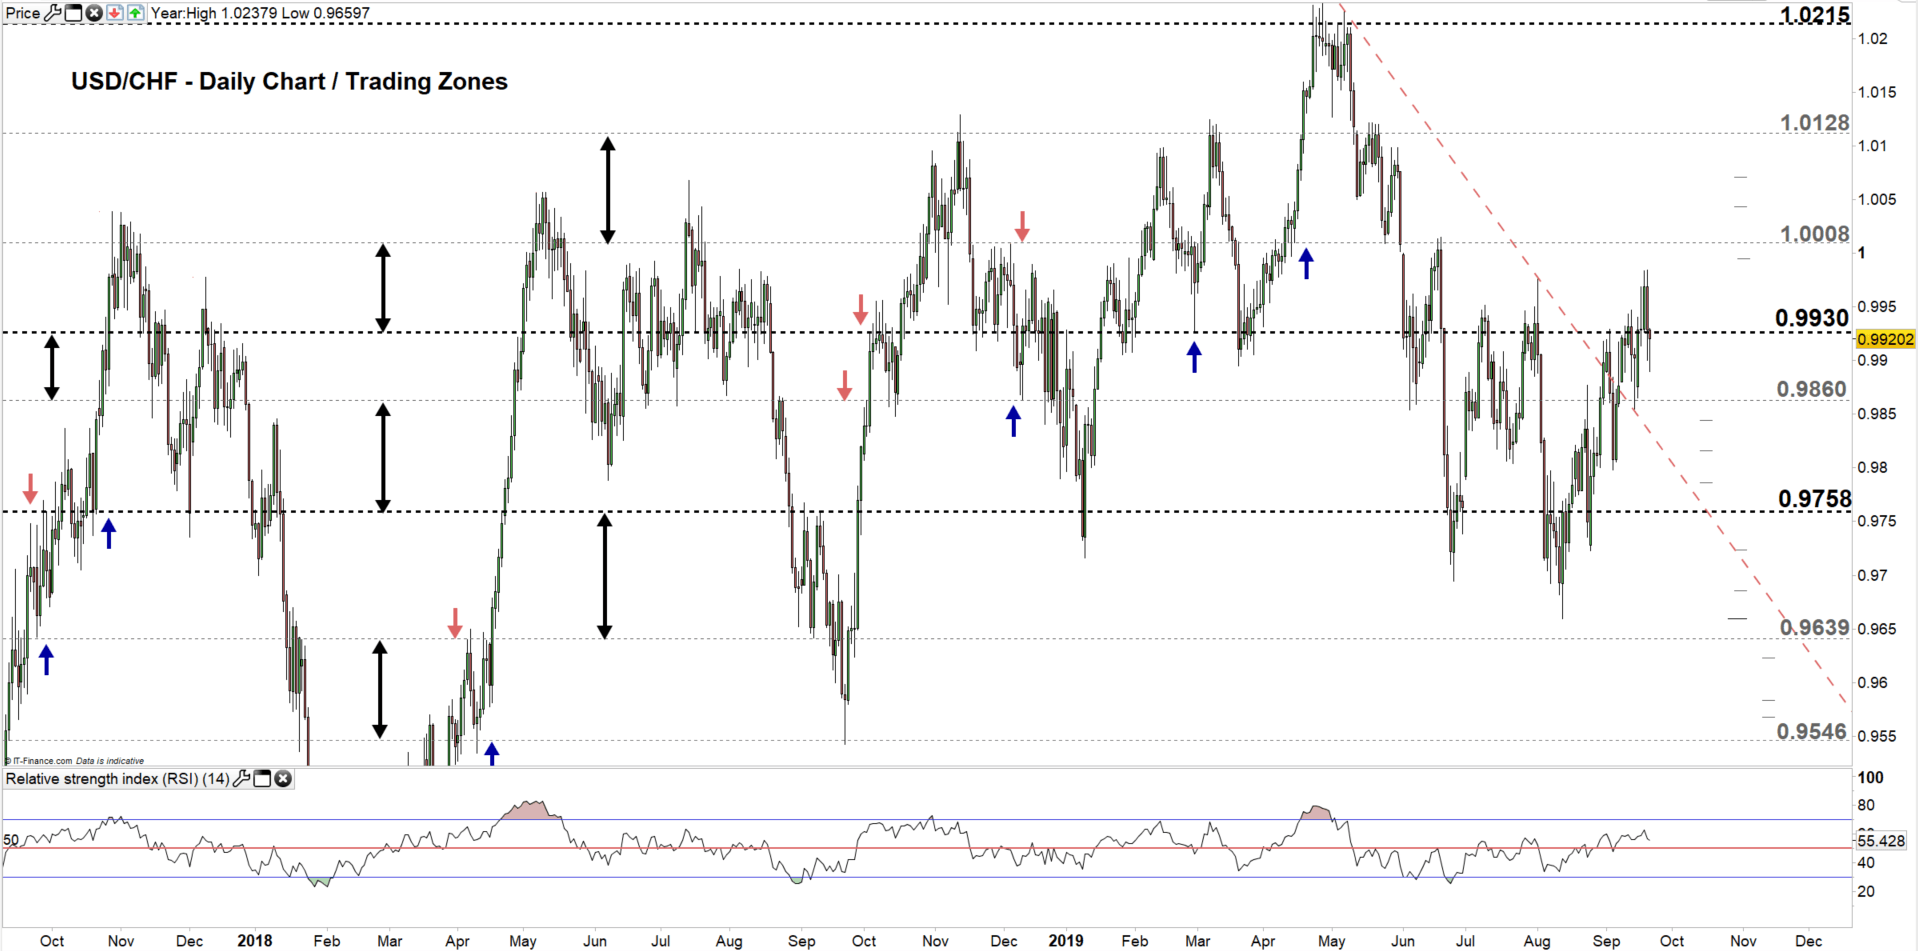
USD/CHF Daily Price Chart (SEP 20, 2017 – SEP 20, 2019) Zoomed Out
USD/CHF Daily Price Chart (JUNE 15 – SEP 20, 2019) Zoomed IN

Looking at daily chart, we notice yesterday USD/CHF declined to a lower trading zone 0.9860 – 0.9930. Today, the pair rebounded from the high end of the zone then traded lower eyeing a test of the low end.
Thus, a close below the low end could send USDCHF towards 0.9758. Further close below this level could see the price trading even lower towards 0.9639. Although, the weekly support area and levels marked on the chart (zoomed in) should be watched closely.
On the other hand, any failure in closing below the low end of the zone could reverse the pair’s direction towards the high end. Further close above the high end could push USDCHF towards the vicinity of 1.008-15 contingent on clearing weekly resistance level underlined on the chart.
Having trouble with your trading strategy? Here’s the #1 Mistake That Traders Make
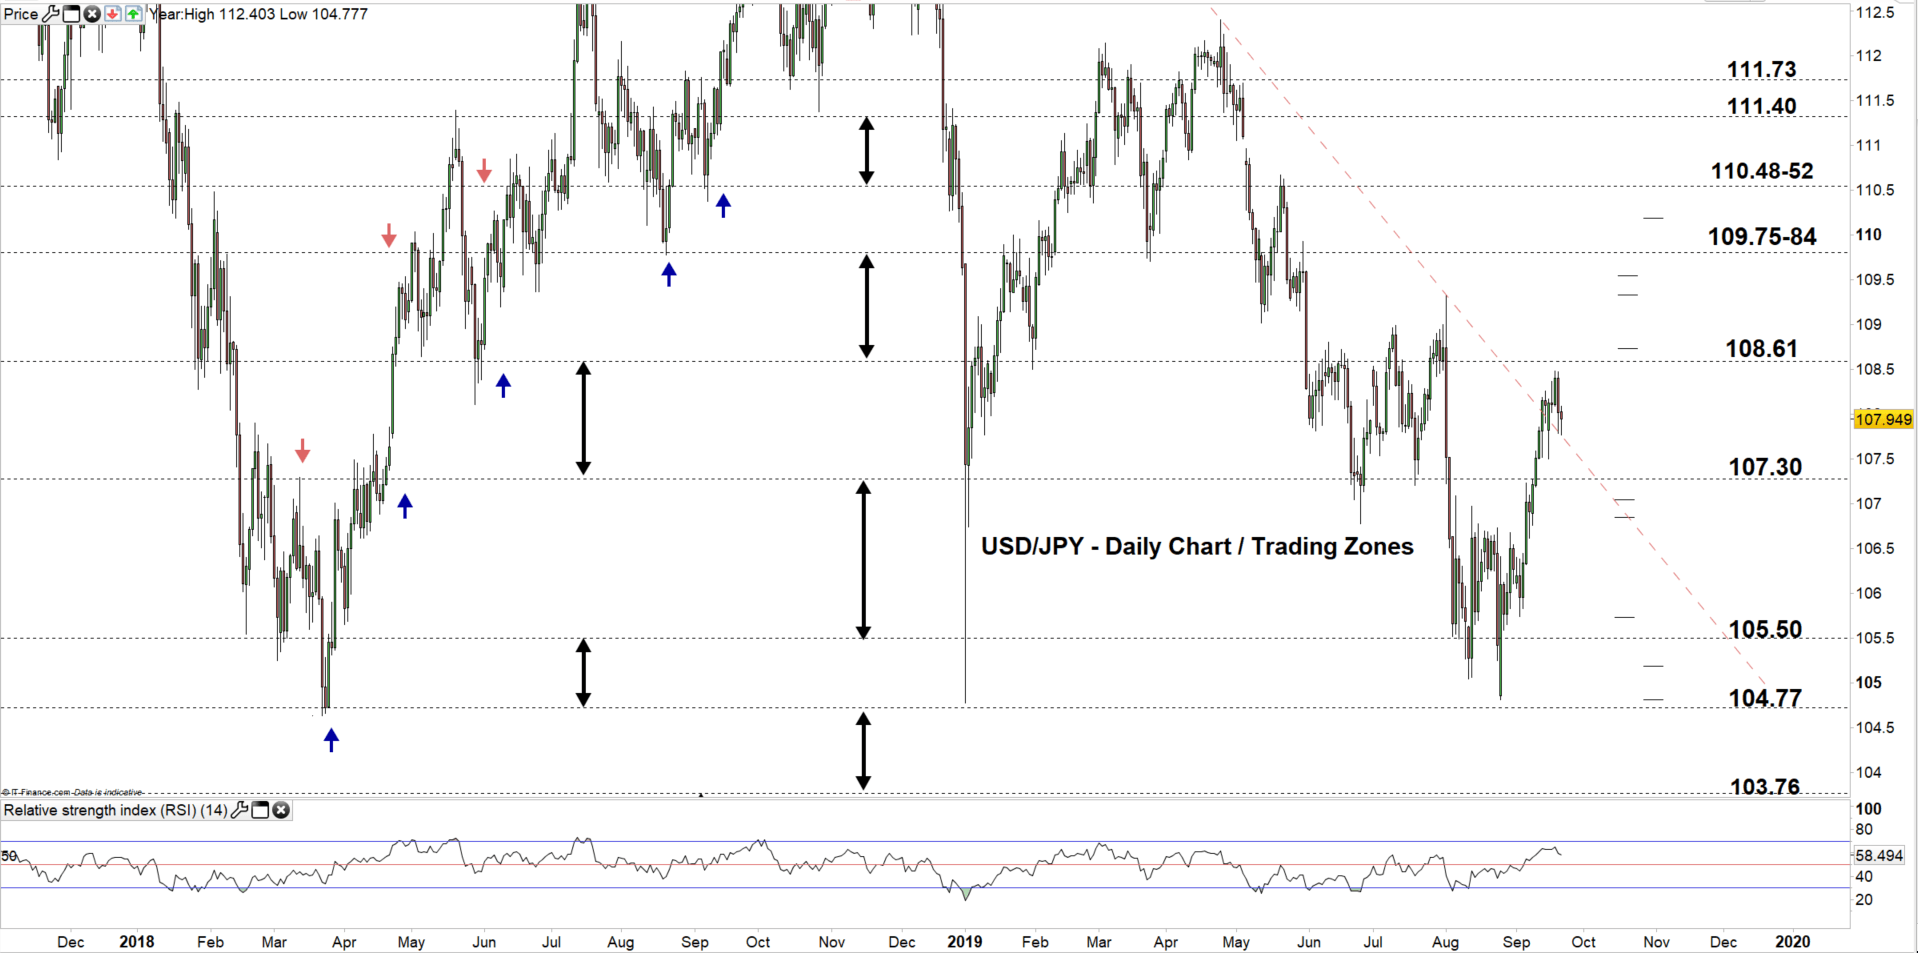
USD/JPY Daily Price Chart (NOV 10, 2017 – SEP 20, 2019) Zoomed Out
USD/JPY Daily Price Chart (JUN 5 – SEP 20, 2019) Zoomed IN
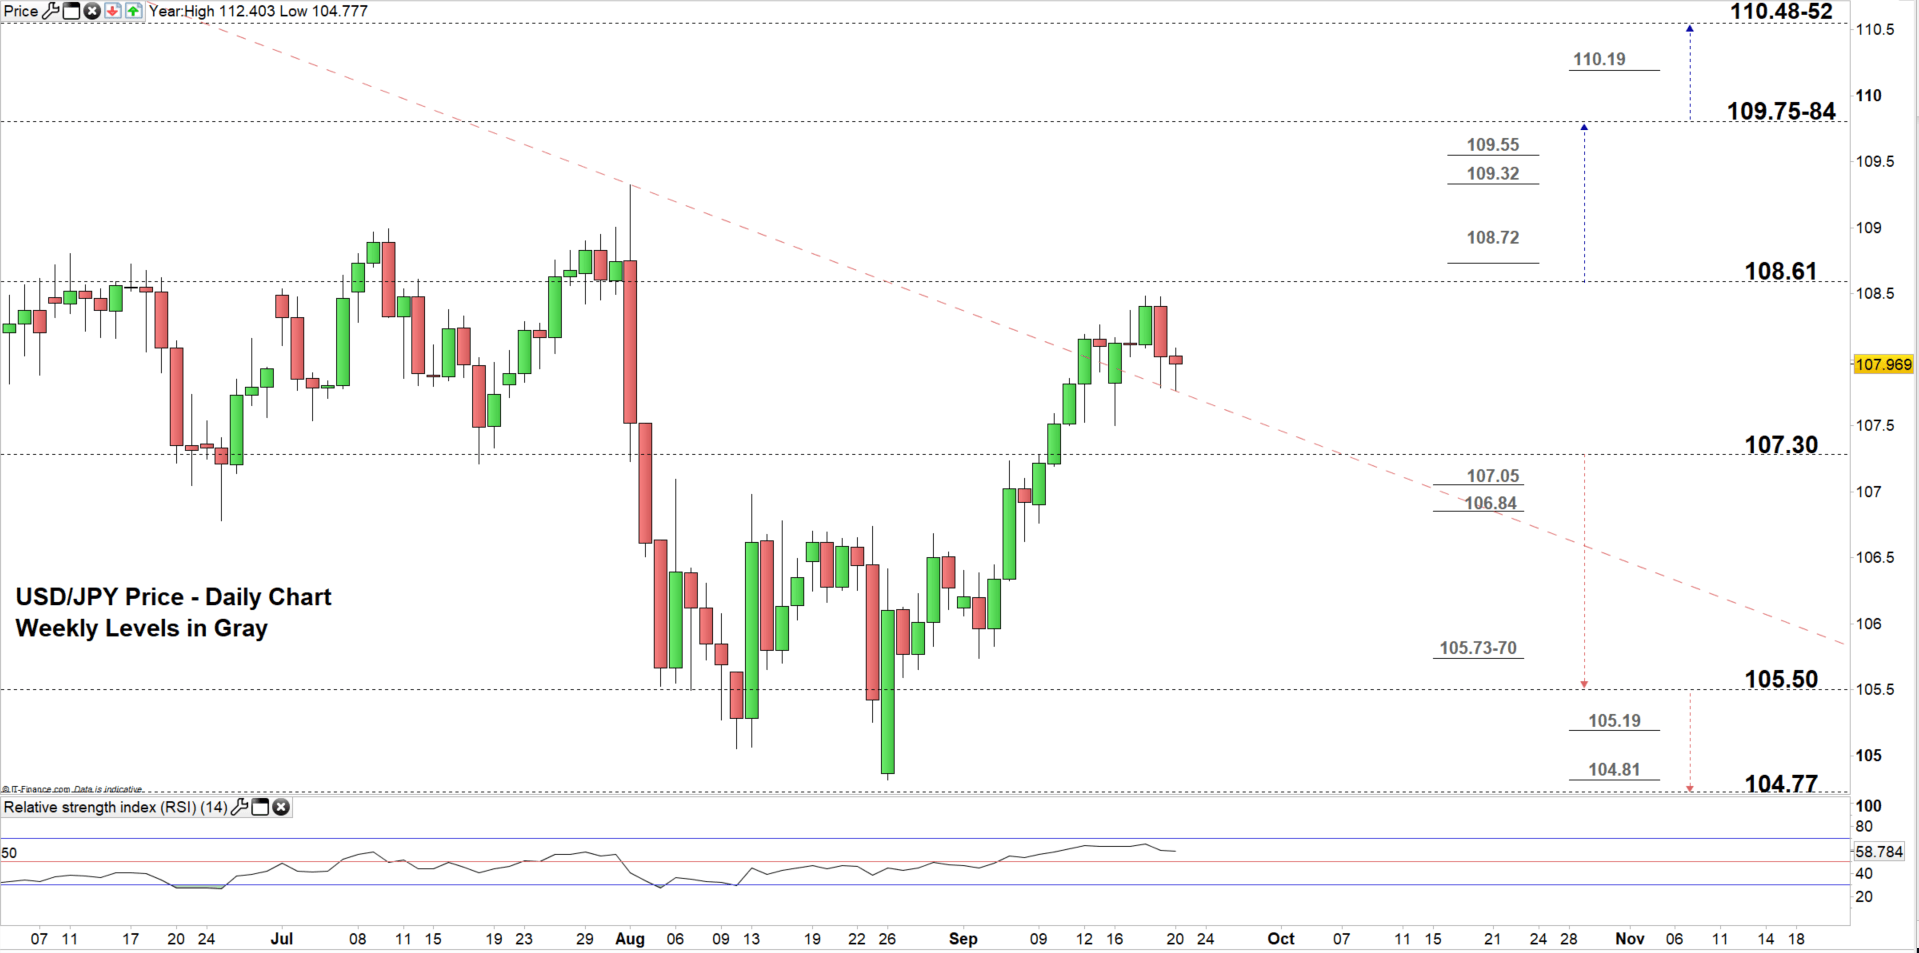
Looking at the daily chart, we notice on Sep 10 USD/JPY moved to a higher trading zone 107.30 – 108.61. The price broke above the downtrend line originated from the April 24 high at 112.40 then yesterday found support at this line.
Thus, USDJPY may be on its way for a test of the high end of the zone. A close above the high end could push the pair towards the vicinity of 109.75-84. That said, the weekly resistance levels underscored on the chart (zoomed in) would be worth monitoring.
In turn, any close below the low end of the zone could press USDJPY towards 105.50. Nonetheless, the weekly support levels underlined on the chart should be kept in focus.
Written By: Mahmoud Alkudsi
Please feel free to contact me on Twitter: @Malkudsi