
2020 Election, S&P 500, Fiscal Talks, Final Presidential Debate, Coronavirus - Talking Points
- S&P 500 unimpressed by ongoing fiscal talks as election nears
- Third and final presidential debate coming up: what to expect
- Why might the S&P 500 index target an inflection point 3361?
14 DAYS UNTIL THE US PRESIDENTIAL ELECTION
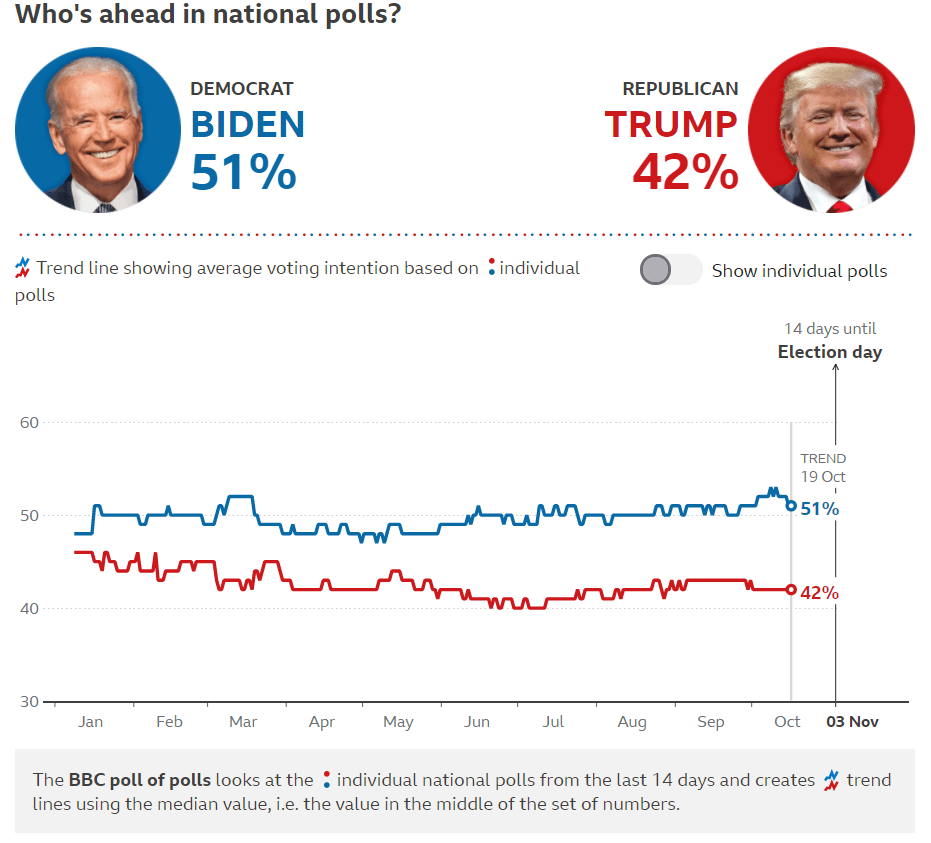
It is officially two weeks before the election on November 3, and the race appears to be tightening between Democratic nominee Joe Biden and President Donald Trump. Following the first debate, the latter’s popularity plummeted and was further exacerbated after reports confirmed he was infected with Covid-19. However, that dynamic appears to have reversed, and election betting odds reinforce that narrative.
2020 US Election Polls
Congress and Fiscal Stimulus: What’s Happening?
White House Chief of Staff Mark Meadows reported that while Speaker of the House Nancy Pelosi and himself had constructive talks but still “have ways to go”. She will be speaking with Treasury Secretary Steven Mnuchin on Wednesday to hammer out additional details. The White House has attempted to concede to the Democrats by raising the fiscal threshold to $1.9t, a few billion short of the $2.2t package they wanted.
Developments on the state of fiscal talks continue to whipsaw markets as they recalibrate their positions to optimize portfolio performance in the constantly-shifting geopolitical landscape. This dynamic is amplified by the tightening race between Biden and Trump. Looking ahead, the S&P 500 and other growth-anchored assets may find themselves hurled around by erratic election and fiscal-related developments.
S&P 500 Analysis
The S&P 500 index appears to be uninspired by ongoing fiscal stimulus talks between Republicans and Democrats as the cost of bipartisan intransigence continues to rise. The next key level that the benchmark may test is a familiar inflection point at 3361.0 where it had previously stalled in early September and early October.
S&P 500 - Daily Chart
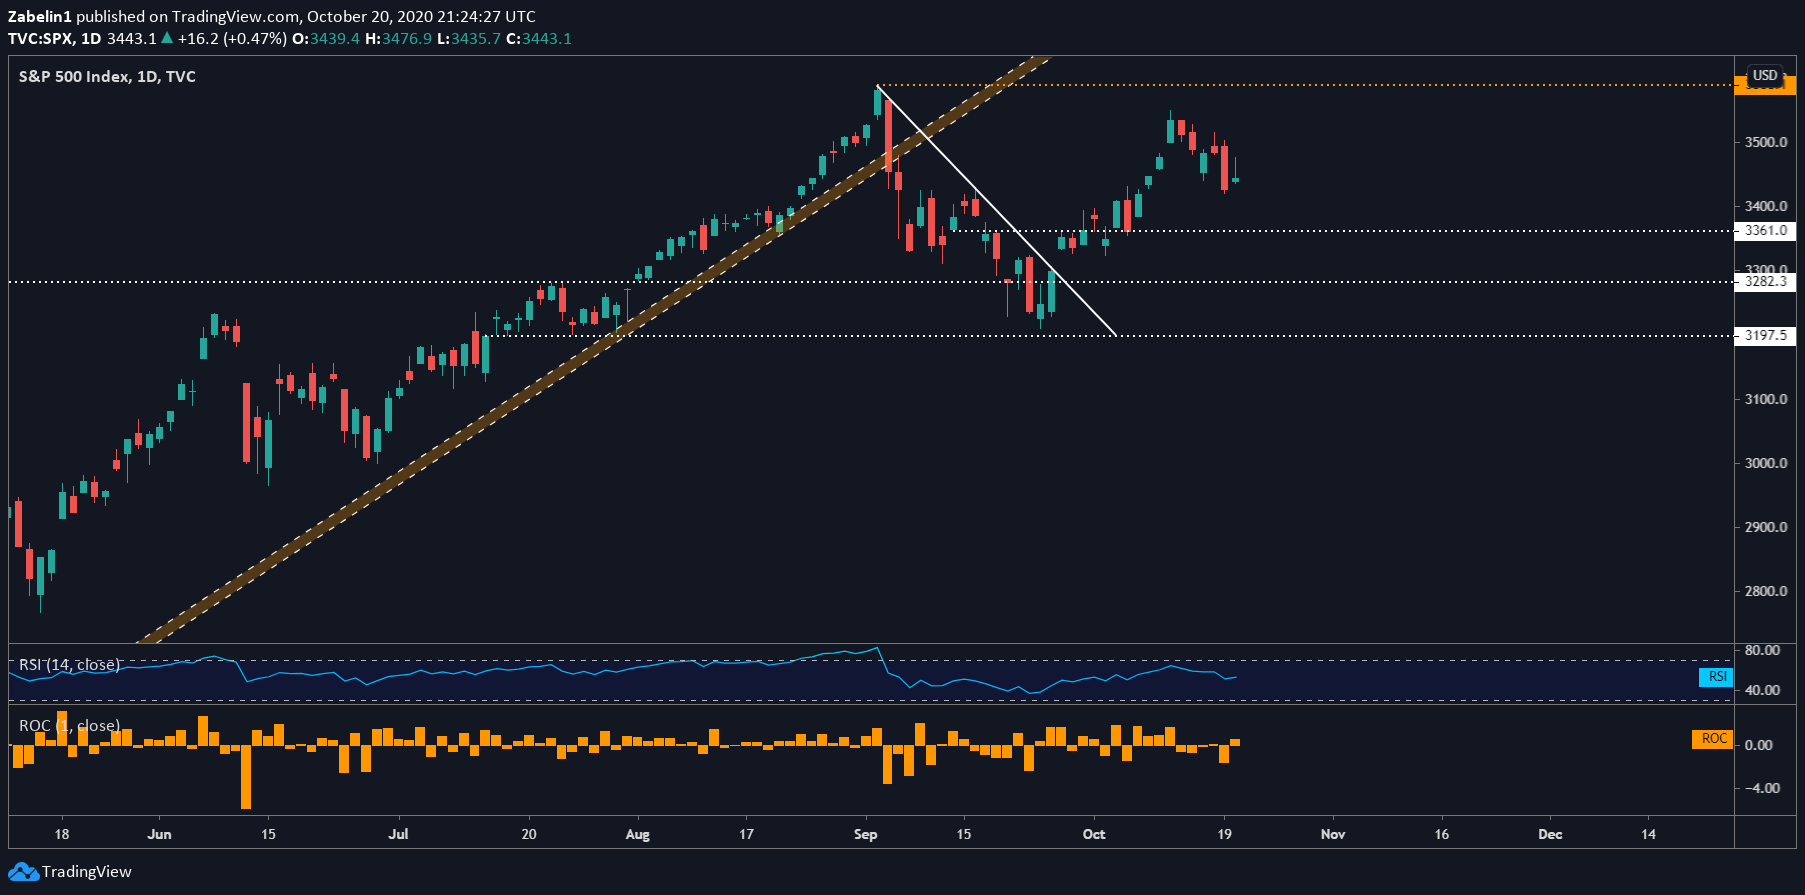
S&P 500 chart created using TradingView
Bouncing from that level could signal that traders are not yet ready to capitulate, but at the same time are perhaps not quite yet confident retesting the all-time high at 3588.1. This may lead to a period of congestion, however the political volatility of the situation revolving around fiscal stimulus and the magnitude of its implications could cause the S&P 500 to aggressively spike or plunge.
--- Written by Dimitri Zabelin, Currency Analyst for DailyFX.com
To contact Dimitri, use the comments section below or@ZabelinDimitrion Twitter