NZD/USD Technical ANALYSIS: BEARISH
- New Zealand Dollar hits 5-month high but signs of topping remain
- Negative RSI divergence hints secondary top forming at resistance
- Close under 0.6425 would suggest long-term downtrend resuming
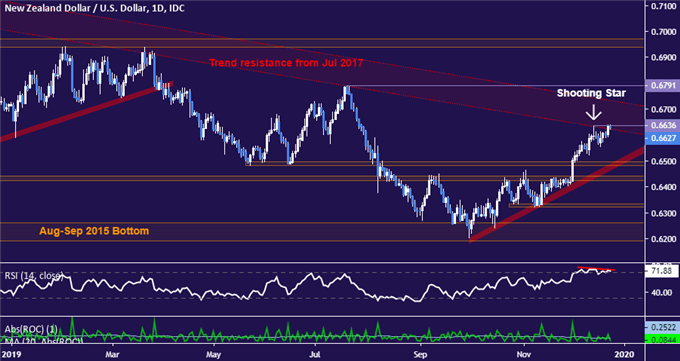
So far, New Zealand Dollar sellers have been unable to build on early signs of bearish reversal – a seemingly telltale Shooting Star candlestick on a test of dominant trend resistance set from July 2017. Yet a reversal lower may still be in the cards, albeit after the begrudging formation of a secondary top.
A half-hearted attempt at a selloff soon gave way to directionless drift, followed by a formidable foray to the upside. While this move set a higher high, it fell conspicuously short of closing above the Shooting Star peak. Ominously negative RSI divergence now warns of ebbing upward momentum.
This is a pattern that occurs often enough to notice. A topping sequence begins with an initial attempt at peaking, which is then followed by a nominally higher high that fails to confirm a breakout and translates into an adverse RSI signal. This scenario is of course unconfirmed itself for now, but it is plausible.
Major support is clustered in the 0.6425-96 zone, where prior areas of congestion and trend support set from October’s bottom meet. Breaking below that would be a very compelling indication that the long-term downtrend has resumed. Neutralizing it in earnest probably requires a break above 0.68.

NZD/USD daily chart created using TradingView
NZD/USD TRADING RESOURCES:
- Just getting started? See our beginners’ guide for FX traders
- Having trouble with your strategy? Here’s the #1 mistake that traders make
- Join a free live webinar and have your trading questions answered
--- Written by Ilya Spivak, Currency Strategist for DailyFX.com
To contact Ilya, use the Comments section below or @IlyaSpivak on Twitter

