
Long Term Crude Oil Price Pattern Nears Terminal Point

The Elliott Wave forecast for crude oil prices show a mature up trend and that a significant portion of the previous two year up trend may be retraced.
Crude Oil Elliott Wave Talking Points:
- Weekly crude oil chart shows price nearing the end of a two year long wave
- Anticipating a bearish reversal to retrace a significant portion of the 2016-2018 up trend
- Crude oil chart shows wave relationships in the $71-$74 price area as a potential reversal zone
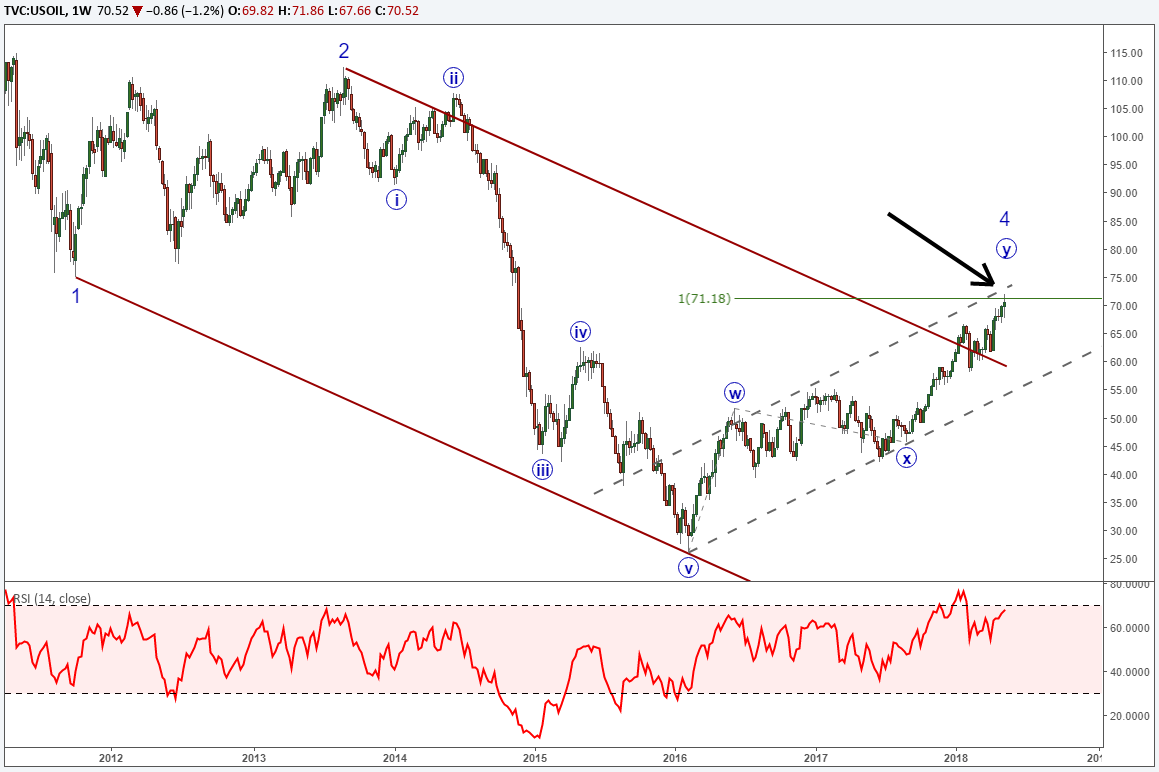
The crude oil Elliott Wave analysis on the weekly price chart shows a bearish pivot may be occurring near current levels to retrace a significant portion of the previous two-year uptrend.
On a weekly crude oil price chart, the Elliott Wave pattern we are following is that the current rise from the 2016 is a wave 4. We are showing this fourth wave as subdividing as a double zigzag pattern labeled W-X-Y. This pattern in general is a bearish pattern and suggests a deep correction may be on the horizon for crude oil prices.
An Elliott Wave double zigzag pattern is simply two zigzags joined together by another corrective pattern labeled ‘X’. In this case, the ‘X’ wave is a clear triangle pattern. Within this double zigzag pattern, wave ‘Y’ is equal in length to wave ‘W’ near $71.18. This is a common relationship between the W and Y waves. We displayed this relationship earlier this week while crude oil prices continued their up trend.
Higher Probability Elliott Wave Counts for Intraday Crude Oil Charts
Dialing in to shorter time frame charts, we can see an Elliott Wave chart that is nearing its terminal point if it has not reached it already.
Using Elliott Wave Theory, wave ‘Y’ in a double zigzag would need to be a zigzag pattern. There is some question as to the shape of wave (b) of Y so we will share with you two higher probability patterns.
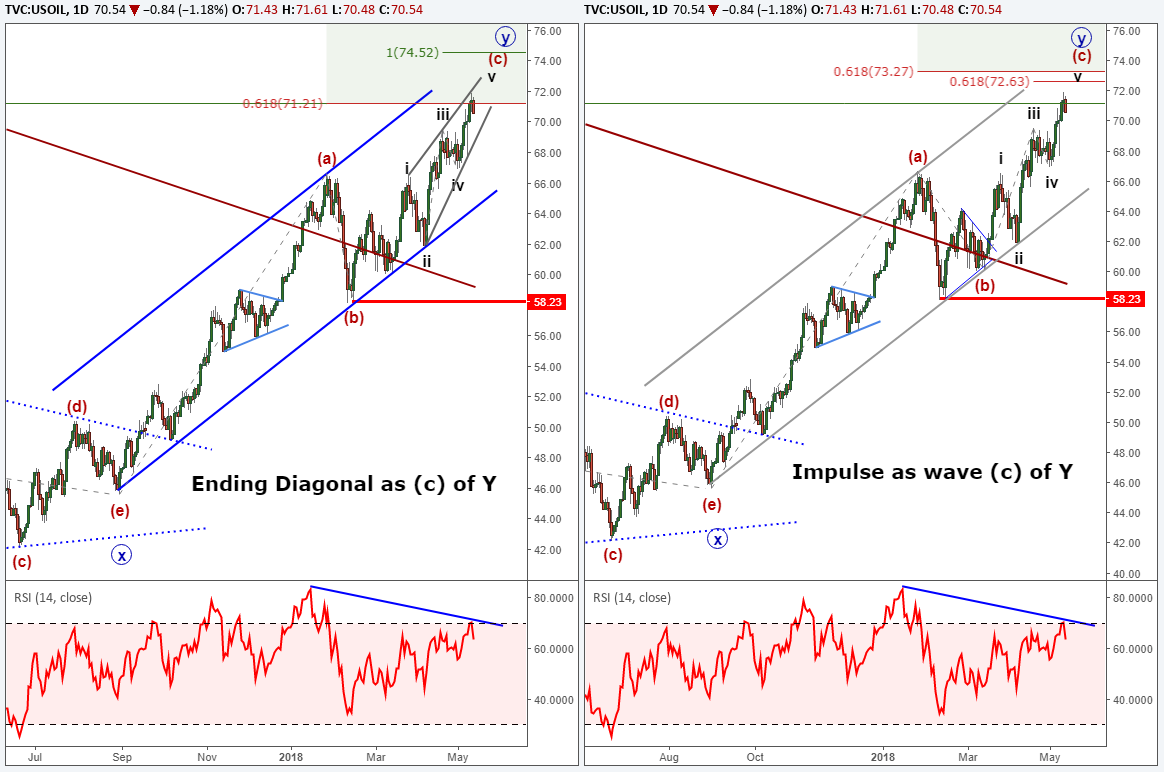
The first one is a very bearish scenario depicted on the left side above. This shows wave (b) of Y as a sharp correction that ended on February 14 followed by an ending diagonal pattern higher. Ending diagonal patterns can appear at the end of a long trend and signals a tiring trend.
Using the rules of the Elliott Wave principle, we can place a maximum price potential of this pattern at $74.52. If crude oil prices press beyond $74.52, then another pattern is at play and the diagonal is eliminated.
Since ending diagonals appear that the end of a long trend, they can signal a swift reversal may be on the horizon back to the beginning of the diagonal. In this case, the diagonal began at $58.23 though a deeper correction can take hold.
On the right side of the chart above, we show wave (b) of Y as another triangle pattern. Under this scenario, wave (c) would be labeled as an impulse wave that may delay the top and reversal as wave ‘v’ of the impulse could extend higher.
A couple of wave relationships are appearing between $72.63 and $73.27 though we cannot rule out even higher prices. $58.23 is the key level to this pattern in that once it is broken, the odds will shift that wave ‘Y’ is finished.
What happens after wave Y in the Elliott Wave principle?
After wave ‘Y’ prints, a deep retracement typically occurs. It could be another ‘X’ wave or a deep correction that retraces the entire two-year uptrend. Either way, the odds are high that a deep correction is looming on the crude oil charts.
Elliott Wave Theory FAQs
How can a trader learn more about Elliott Wave Theory?
We have a beginner and advanced Elliott Wave guide to help traders learn more about the Elliott Wave method of analysis. Additionally, follow DailyFX’s Elliott Wave articles and webinars to see the analysis being used in real time.
What markets is Elliott Wave Theory best applied?
Elliott Wave Theory is best applied to the liquid markets. Therefore, you will see me apply my analysis to major and common FX pairs, stock indices, common commodities like gold, silver, copper, and energy like oil or natural gas.
If you are not sure if Elliott Wave is for you, consider reading some materials that will help you get started in trading FX with some commentary on the habits that make successful traders.
How do you trade Elliott Wave ending diagonal patterns?
Ending diagonal patterns are one of my favorite patterns because they offer clearly defined risk and take profit levels. We discuss these general parameters in our four step guide to trade diagonal patterns.
---Written by Jeremy Wagner, CEWA-M
Jeremy is a Certified Elliott Wave Analyst with a Master’s designation. These articles are designed to show Elliott Wave analysis in the live market environment for educational purposes. Read more of Jeremy’s Elliott Wave reports via his bio page.
Follow on twitter @JWagnerFXTrader .
Challenges And Rewards Of Expat Life In Asia
The freedoms, novelties, and richness of new experiences that typify the expat way of living constitute the crux of the ... Read more
NZD/USD Wedge Breakout Back In Play As US Dollar Strength Cools
NZD/USD is looking higher ahead of Australian and New Zealand inflation expectations. Meanwhile, China's credit conditio... Read more
Australian Dollar Outlook: AUD/USD Eyes Westpac Consumer Confidence
The Australian Dollar is seeing a mild rebound following a Rising Wedge breakdown. AUD/USD may see volatility on Westpac... Read more
NZD/USD May Weaken As Goldman Sachs Downgrades Chinese Growth Outlook
The New Zealand Dollar fell overnight against the US Dollar as Covid and Chinese economic downgrades weighed on sentimen... Read more
AUD/USD Threatens Key Technical Level As Chinese Inflation Data Nears
AUD/USD is threatening a breakdown as prices test support at the floor of a Rising Wedge chart pattern. Chinese inflatio... Read more
Australian Dollar Forecast: AUD/USD May Move On RBA, Covid, China, US NFPs
The Australian Dollar is benefiting from a rebound in sentiment after Wall Street closed higher. AUD/USD looks to the RB... Read more