
Gold Prices May See $1200 In The Coming Weeks

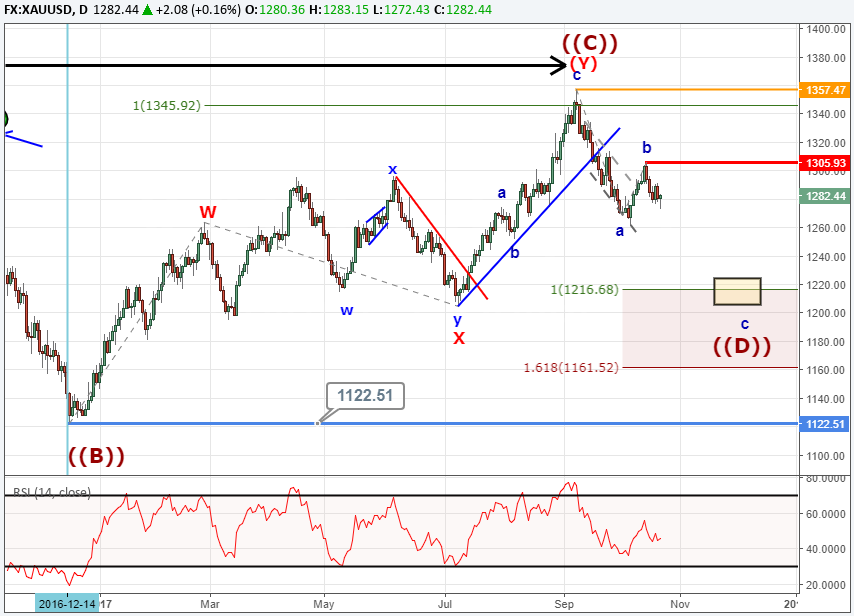
Gold prices continue to trade on their heels for the past several weeks. The bounce higher in early October has proven temporary as anticipated. We think gold price is working lower in the fourth leg (‘D’ wave) of an Elliott Wave triangle. We are anticipating that gold prices will eventually pressure $1200 before the fifth and final leg of the triangle begins.
According to Elliott Wave theory, triangles consist of five waves where the price extremes contract to form the shape of a triangle. Each wave of the triangle would consist of zigzags, multiple zigzags, or triangles. Therefore, we are anticipating the ‘D’ wave in gold prices to work lower in an A-B-C zigzag pattern.
Struggling with your trading? This could be why.
Gold Price Forecast Towards $1200
Zooming in on a gold price chart, we can see the first wave of the zigzag is complete. It is possible to consider the second wave, the ‘B’ wave, complete as well (left side below). If this wave count is correct, then gold prices would fall hard in the ‘C’ wave to near $1215.
Another option we are following is that the ‘B’ wave is still carving a sideways flat pattern (right side of chart below). Under this model, prices would bump higher back towards $1305 where another opportunity to short the market would exist.
Gold Intraday Patterns October 23, 2017
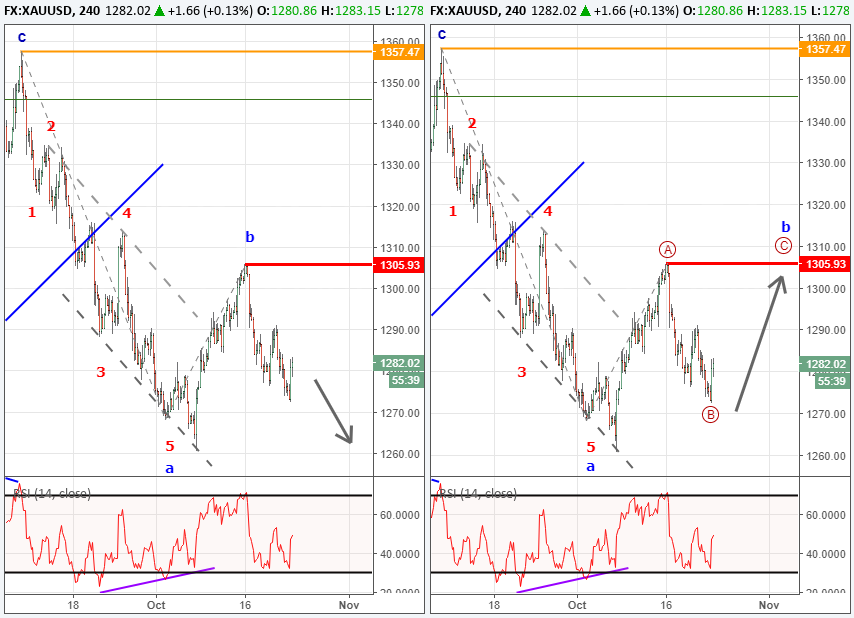
Under both scenarios noted above, the models point to an eventual sell off towards $1200 so long as gold prices remain below the September 8 high of $1357. Shorter term traders could use the $1306 high to maintain a bearish bias against. As mentioned above, a move higher than $1306 does not turn the bias to bullish, but simply delays the bearish pattern we are following.
From a sentiment perspective, the ratio of net long to net short traders has remained positive and currently reads +3.3. This indicates the majority of traders are positioned net long in gold. Sentiment is a good contrarian tool so with the majority of traders net long, we would use that as a signal to short. Follow the sentiment of live traders through our sentiment page.
The bottom line is we look for gold prices continue its trend lower towards $1200 in the ‘D’ leg of an Elliott Wave triangle. We are viewing rallies to be temporary and partial retracements with selling pressure eventually coming back. The key level for this analysis is the September 8 high of $1357. Above $1357, we will need to reassess the Elliott wave count.
Learn more about the Elliott Wave patterns by receiving our beginner and advanced Elliott Wave guides.
---Written by Jeremy Wagner, CEWA-M
Jeremy is a Certified Elliott Wave Analyst with a Master’s designation. These articles are designed to illustrate Elliott Wave applied to the current market environment.
Learn more about triangle patterns by watching this one hour long webinar recording devoted to triangles. Here is another one hour long webinar recording devoted to zigzag patterns.
Discuss this market with Jeremy in Monday’s US Opening Bell webinar.
Follow on twitter @JWagnerFXTrader .
Join Jeremy’s distribution list.
Recent Elliott Wave articles by Jeremy:
Challenges And Rewards Of Expat Life In Asia
The freedoms, novelties, and richness of new experiences that typify the expat way of living constitute the crux of the ... Read more
NZD/USD Wedge Breakout Back In Play As US Dollar Strength Cools
NZD/USD is looking higher ahead of Australian and New Zealand inflation expectations. Meanwhile, China's credit conditio... Read more
Australian Dollar Outlook: AUD/USD Eyes Westpac Consumer Confidence
The Australian Dollar is seeing a mild rebound following a Rising Wedge breakdown. AUD/USD may see volatility on Westpac... Read more
NZD/USD May Weaken As Goldman Sachs Downgrades Chinese Growth Outlook
The New Zealand Dollar fell overnight against the US Dollar as Covid and Chinese economic downgrades weighed on sentimen... Read more
AUD/USD Threatens Key Technical Level As Chinese Inflation Data Nears
AUD/USD is threatening a breakdown as prices test support at the floor of a Rising Wedge chart pattern. Chinese inflatio... Read more
Australian Dollar Forecast: AUD/USD May Move On RBA, Covid, China, US NFPs
The Australian Dollar is benefiting from a rebound in sentiment after Wall Street closed higher. AUD/USD looks to the RB... Read more