
Gold Price Analysis: The Bullish Pattern Poised For $1375 Retest

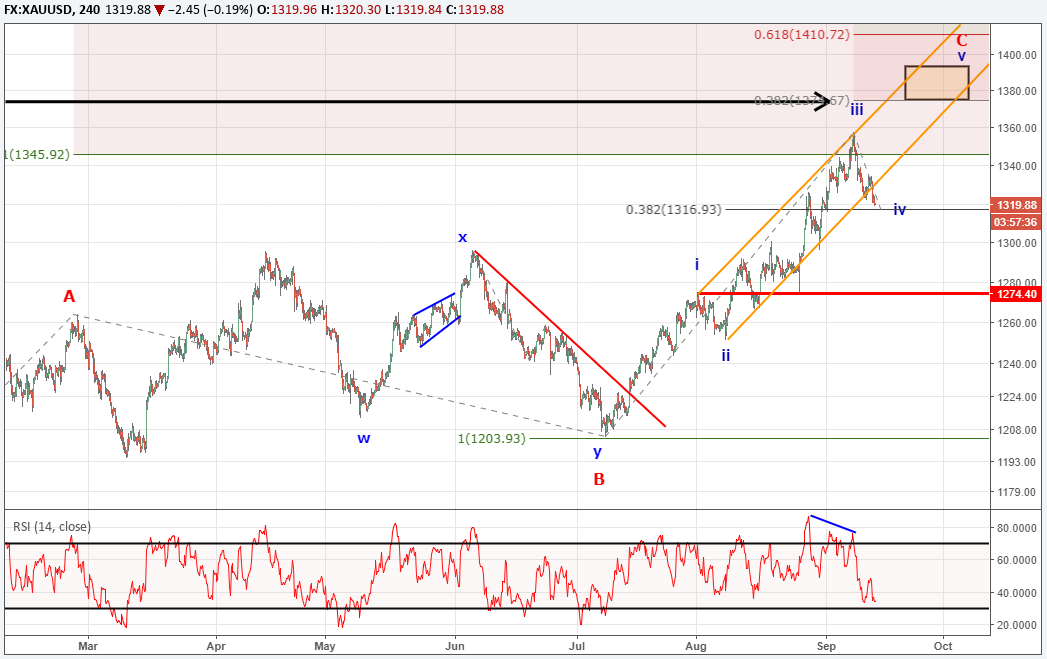
Gold prices have been correcting lower for the past couple days and have reached a zone of interest. The Elliott Wave model we are following hints at support forming between now and $1310. The next move higher then becomes an ending wave.
It appears as though prices are correcting lower in a small degree wave iv. Typically wave iv in an impulse corrects towards the 38% retracement level of wave iii. If my wave labelling is correct, then gold prices may find support near $1317 and possibly down towards $1310. If price corrects below $1274, then the wave count is incorrect and we will reassess what the other models are indicating.
If gold prices are supported in this $1310-$1320 price zone, then we will look for a break higher that tests $1375.
$1375 is a big level for multiple reasons. There is a wave relationship that appears near there. Wave v is .382 the length of waves i-iii. In addition, the July 2016 high circles around in the same price zone. Therefore, we expect a battle between the bulls and bears to occur near this zone. We will likely see a reaction lower, but we cannot rule out a break higher eventually.
The IG Client sentiment reading for gold is at +1.79. The number of traders net long gold have decreased since the beginning of July. This could be a subtle clue for bullish traders as the sentiment reading has been dropping from even more extreme levels. Follow live trader positioning in gold.
Bottom line, look for gold prices to pivot higher near these current levels with a target near $1375. Below $1274 and we will need to reassess the Elliott Wave count.
Learn more about the Elliott Wave patterns by receiving our beginner and advanced Elliott Wave guides.
---Written by Jeremy Wagner, CEWA-M
Jeremy is a Certified Elliott Wave Analyst with a Master’s designation. These articles are designed to illustrate Elliott Wave applied to the current market environment.
This article references an impulse wave. We have a one hour long webinar recording devoted to the topic of Elliott Wave impulses. Register to view it.
Discuss this market with Jeremy in Monday’s US Opening Bell webinar.
Follow on twitter @JWagnerFXTrader .
Join Jeremy’s distribution list.
GBPUSD Elliott Wave pattern clears up.
Copper prices have fallen hard…is this the beginning of a new down trend?
Challenges And Rewards Of Expat Life In Asia
The freedoms, novelties, and richness of new experiences that typify the expat way of living constitute the crux of the ... Read more
NZD/USD Wedge Breakout Back In Play As US Dollar Strength Cools
NZD/USD is looking higher ahead of Australian and New Zealand inflation expectations. Meanwhile, China's credit conditio... Read more
Australian Dollar Outlook: AUD/USD Eyes Westpac Consumer Confidence
The Australian Dollar is seeing a mild rebound following a Rising Wedge breakdown. AUD/USD may see volatility on Westpac... Read more
NZD/USD May Weaken As Goldman Sachs Downgrades Chinese Growth Outlook
The New Zealand Dollar fell overnight against the US Dollar as Covid and Chinese economic downgrades weighed on sentimen... Read more
AUD/USD Threatens Key Technical Level As Chinese Inflation Data Nears
AUD/USD is threatening a breakdown as prices test support at the floor of a Rising Wedge chart pattern. Chinese inflatio... Read more
Australian Dollar Forecast: AUD/USD May Move On RBA, Covid, China, US NFPs
The Australian Dollar is benefiting from a rebound in sentiment after Wall Street closed higher. AUD/USD looks to the RB... Read more