
GBP/USD Elliott Wave Pattern Clears Up

Today’s monster rise in GBP/USD clears up its technical pattern. From a big picture perspective, we have been anticipating a meaningful and long term top to form near the neighborhood of 1.3450. We previously wrote in our Q3 GBP forecast “our model suggests 1.3450 may be strong enough to contain prices over the coming quarter.” Today’s rise adds another wave relationship to the 1.3450 camp to make that level even stronger, should prices arrive there.
2
Grab our GBP Forecast Q3 (download here)
We are interpreting this current wave higher to be an ending wave at two degrees of trend. If correct, this implies a large reversal is lurking nearby within the next couple hundred pips. If GBP/USD makes it to 1.3450, be on the lookout for a reaction lower.
For those Elliott Wave nerds, and those wanting to learn more on this analytical method, let us get technical.
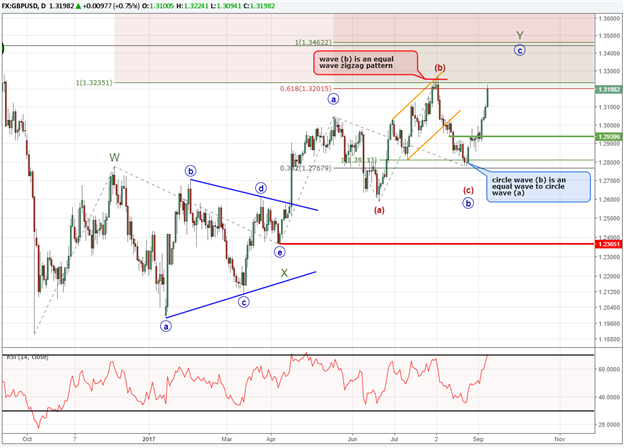
We appear to be in a ‘Y’ wave of a W-X-Y complex upward correction. Wave ‘Y’ began on April 7, 2017 and is constructed of three waves labeled circle a-b-c.
Struggling with your trading? This could be why.
“Y” Waves
We explained in our last GBP article how this ‘Y’ wave was determined to be an ending wave. That analysis is still the higher probability count.
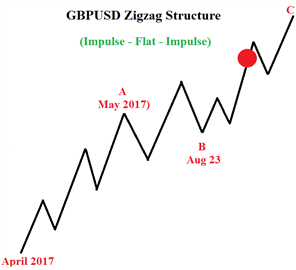
For those unfamiliar with Elliott Wave Theory, ‘Y’ waves are three wave moves. We can count a zigzag pattern, which is a three wave move, from April 7 to current. In this zigzag, it appears to be subdividing as 5-3-5 (impulse-running flat-impulse).
Harmonized Waves in the Flat
My recent radio silence on GBP/USD was due to losing its scent once the pair broke 1.3247 in early August. As it turns out, the early August break higher was a (b) wave of a small flat correction. B waves in flats tend to be sucker waves and a false breakout. This one fit the bill as the breakout above the May 2017 high was proven temporary. Now, the range that developed between May and August maps out well as a running flat.
Within the (a)-(b)-(c) flat pattern, the (b) wave is an equal wave pattern and the (c) wave is equal in length to wave (a). My point is there is harmony within this pattern that I was missing earlier, causing me to be thrown off the scent. For those keeping score at home the circle wave ‘b’ is a running flat.
What’s next?
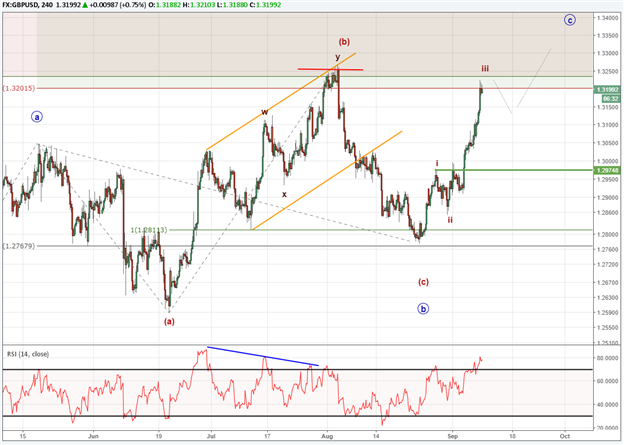
When looking at the intraday chart above, we are waiting for the impulse wave from August 24 to end. It appears we are getting ready to finish wave iii of v so the intraday pattern is appears incomplete to the upside.
Since there are strong wave relationships near 1.3450, the fifth and final wave may end in that price zone. We will monitor this closely for signs of exhaustion.
This is a big pattern that once it completes, we are anticipating for a reversal to work back towards 1.19. Of course, this is predicated on the correct analysis of the Elliott Wave pattern.
---Written by Jeremy Wagner, CEWA-M
Discuss this market with Jeremy in Monday’s US Opening Bell webinar.
For further study on Elliott Wave patterns, watch these one hour long webinar recordings devoted to each topic. [registration required]
Follow on twitter @JWagnerFXTrader .
Join Jeremy’s distribution list.
Copper Prices Fall 3.5% Today – Beginning of a New Down Trend?
Challenges And Rewards Of Expat Life In Asia
The freedoms, novelties, and richness of new experiences that typify the expat way of living constitute the crux of the ... Read more
NZD/USD Wedge Breakout Back In Play As US Dollar Strength Cools
NZD/USD is looking higher ahead of Australian and New Zealand inflation expectations. Meanwhile, China's credit conditio... Read more
Australian Dollar Outlook: AUD/USD Eyes Westpac Consumer Confidence
The Australian Dollar is seeing a mild rebound following a Rising Wedge breakdown. AUD/USD may see volatility on Westpac... Read more
NZD/USD May Weaken As Goldman Sachs Downgrades Chinese Growth Outlook
The New Zealand Dollar fell overnight against the US Dollar as Covid and Chinese economic downgrades weighed on sentimen... Read more
AUD/USD Threatens Key Technical Level As Chinese Inflation Data Nears
AUD/USD is threatening a breakdown as prices test support at the floor of a Rising Wedge chart pattern. Chinese inflatio... Read more
Australian Dollar Forecast: AUD/USD May Move On RBA, Covid, China, US NFPs
The Australian Dollar is benefiting from a rebound in sentiment after Wall Street closed higher. AUD/USD looks to the RB... Read more