
EURO PRICE OUTLOOK DIMS ON THREAT OF EU-US TRADE WAR: EUR/USD, EUR/GBP, EUR/JPY
- The Euro risks falling with US tariffs on $7.5 billion of goods imported from the EU set to take effect October 18 and looming retaliation already threatened by France’s Le Maire
- EUR/USD, EUR/GBP and EUR/JPY could drop if the EU retaliates and an all-out trade war between the EU and US ensues
- For comprehensive fundamental and technical outlook on the Euro, check out our free 4Q-2019 Forecasts & Trading Guides available for download
The Euro has been on a tear higher over the last three weeks with the EXY Euro Currency Index climbing roughly 2% so far this month. The sharp jump in spot EUR/USD prices has threatened the most liquid forex pair’s overarching downtrend and has sent the DXY US Dollar Index plunging below major technical levels. Yet, a major fundamental risk for Euro lurks on the horizon that has been largely overlooked by markets.
The economic headwind posed by President Trump’s decision to levy tariffs on $7.5 billion of goods imported from the European Union scheduled to go into effect on October 18 – and the more severe threat of EU retaliation likely escalating into a full-blown trade war – could seriously jeopardize the Euro’s recent rally. Though the tariffs levied on EU exports (10% on commercial aircraft, 25% on agricultural and industrial goods) were given the green light by the WTO following the Airbus dispute case, EU officials like France’s Finance Minister Bruno Le Maire stated that the economic bloc will have little choice but to retaliate.
EUR/USD PRICE CHART: WEEKLY TIME FRAME (AUGUST 28, 2016 TO OCTOBER 18, 2019)
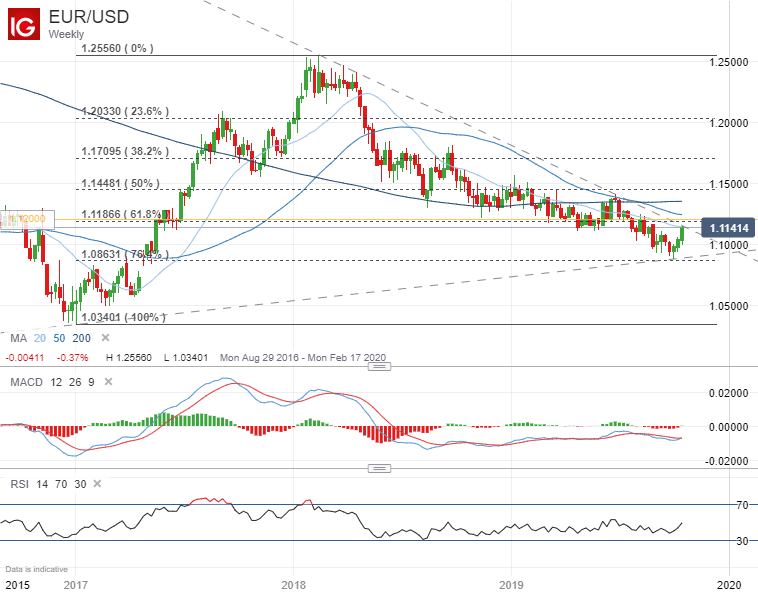
EUR/USD price action is currently flirting with the currency pair’s bearish trendline that connects the swing high printed in February 2018 and lower swing high recorded this past June. This trend resistance could potentially halt the Euro’s latest rebound and send EUR/USD pivoting back lower.
Also, major technical confluence around the 1.1200 price level underpinned by the 61.8% Fibonacci retracement of EUR/USD’s trading range since 2017 as well as its downward-sloping 20-week and 50-week simple moving averages could keep further advances at bay.
EUR/GBP PRICE CHART: DAILY TIME FRAME (MARCH 08, 2019 TO OCTOBER 18, 2019)
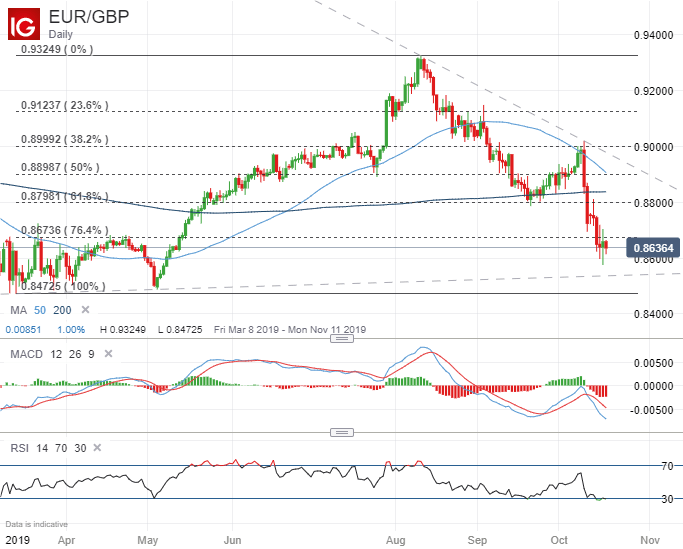
Spot EUR/GBP prices have swooned as of late owing to the influx of Brexit deal optimism, which has indirectly boosted the Euro against its US Dollar counterpart. With MP’s set to vote on the latest Withdrawal Agreement this weekend, the UK could secure a long-waited Brexit deal and further sink EUR/GBP.
However, there is serious uncertainty outstanding until the future Brexit timeline is finalized – a rejection of the Brexit deal this weekend will likely provide an opportunity for EUR/GBP to recover recent downside even with the prospect of a major EU-US trade spat. Conversely, the prospect of an approved Brexit deal and EU-US trade war could send spot EUR/GBP prices down to retest and possibly record fresh year-to-date lows.
EUR/JPY PRICE CHART: WEEKLY TIME FRAME (DECEMBER 18, 2016 TO OCTOBER 18, 2019)
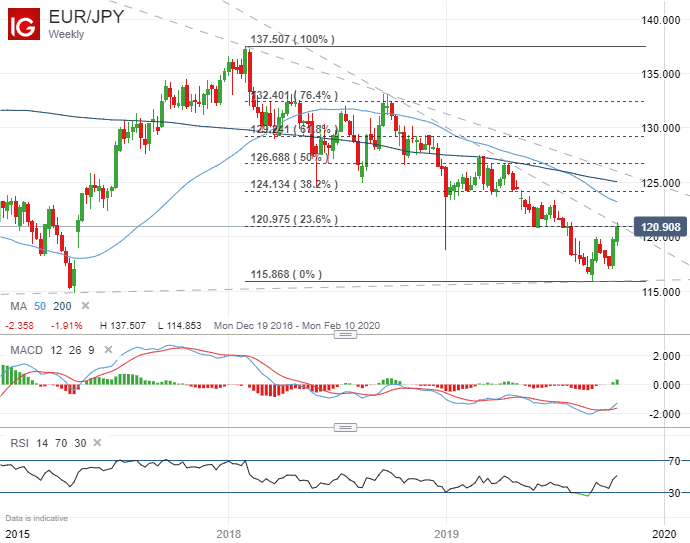
The technical backdrop on a weekly EUR/JPY price chart reveals the Euro’s slow-and-steady churn lower against the Japanese Yen as the Eurozone economy stumbles owing largely to slowing global GDP growth due to the impact of trade wars. This trend may very well continue if EU-US trade relations take a sharp turn for the worse if the EU does in fact decide to retaliate after the US begins levying tariffs on $7.5 billion of European goods. EUR/JPY price action also faces daunting technical resistance posed by the 23.6% Fibonacci retracement of the currency pair’s trading range since 2018 and bearish trendline extended from the lower tops printed September last year and April this year.
A rejection at this level could open up the door to retest EUR/JPY’s year-to-date low – particularly if the reversal lower is sparked by the threat of an EU-US trade war. However, bullish momentum indicated by positive divergence on the MACD and the RSI rising back above 50 could continue and help drive spot EUR/JPY prices higher toward its 50-week SMA and 38.2% Fib.
-- Written by Rich Dvorak, Junior Analyst for DailyFX.com
Connect with @RichDvorakFX on Twitter for real-time market insight