
EUR/GBP Outlook
See EUR and GBP guides and find out for free what is likely to move market prices through Q3 from Main Currencies and Commodities Forecasts
EUR/GBP– Bearish Market
Yesterday, EUR/GBP broke below the July 25 low (monthly support) at 0.8891 printing its lowest level in eight weeks. However, the price rallied after and settled above the 0.8900 handle.
Since Aug 21, the Relative Strength Index (RSI) has been moving below 50 emphasizing the bearish outlook of the pair.
Having trouble with your trading strategy? Need a hand? Here’s the #1 Mistake That Traders Make
EUR/GBP DAILY PRICE CHART (June 29, 2017- SEP 13, 2019) Zoomed Out
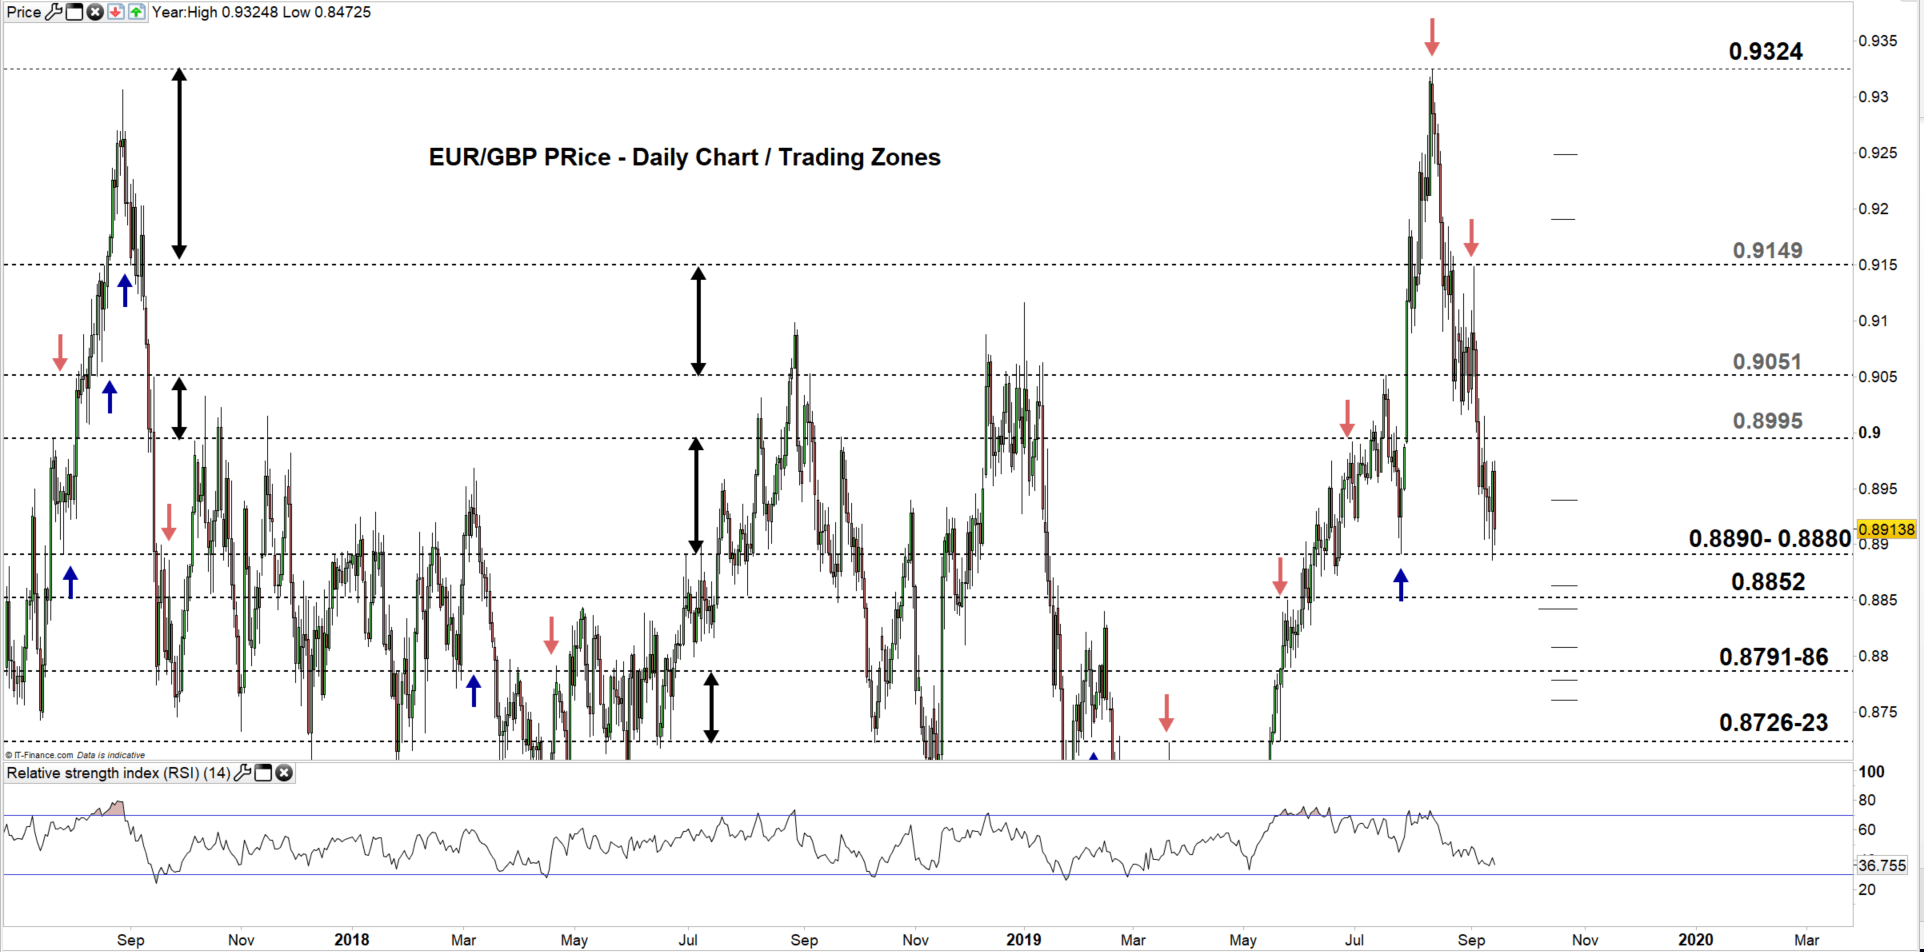
EUR/GBP DAILY PRICE CHART (June 20 – 13 SEP, 2019) Zoomed in

Looking at the daily chart, we notice on Sep 5, EUR/GBP declined to a lower trading zone 0.8995 – 0.8890 since then the price has been looking for a test of the low end of the zone.
Thus, a close below the low end of the zone could press EURGBP towards 0.8852. Further close below this level may see the price trading even lower towards the vicinity of 0.8791-86. That said, sellers need to pay a close attention on the weekly support area and levels marked on the chart (zoomed in).
On the flip-side, any failure in closing below the low end could send the price towards the high end of the zone. Further close above the high end may push EURGBP towards 0.9051. In that scenario, buyers need to monitor closely the weekly resistance levels underlined on the chart.
Just getting started? See our Beginners’ Guide for FX traders
EUR/GBP Four-HOUR PRICE CHART (Aug 30 – 13 Sep, 2019)
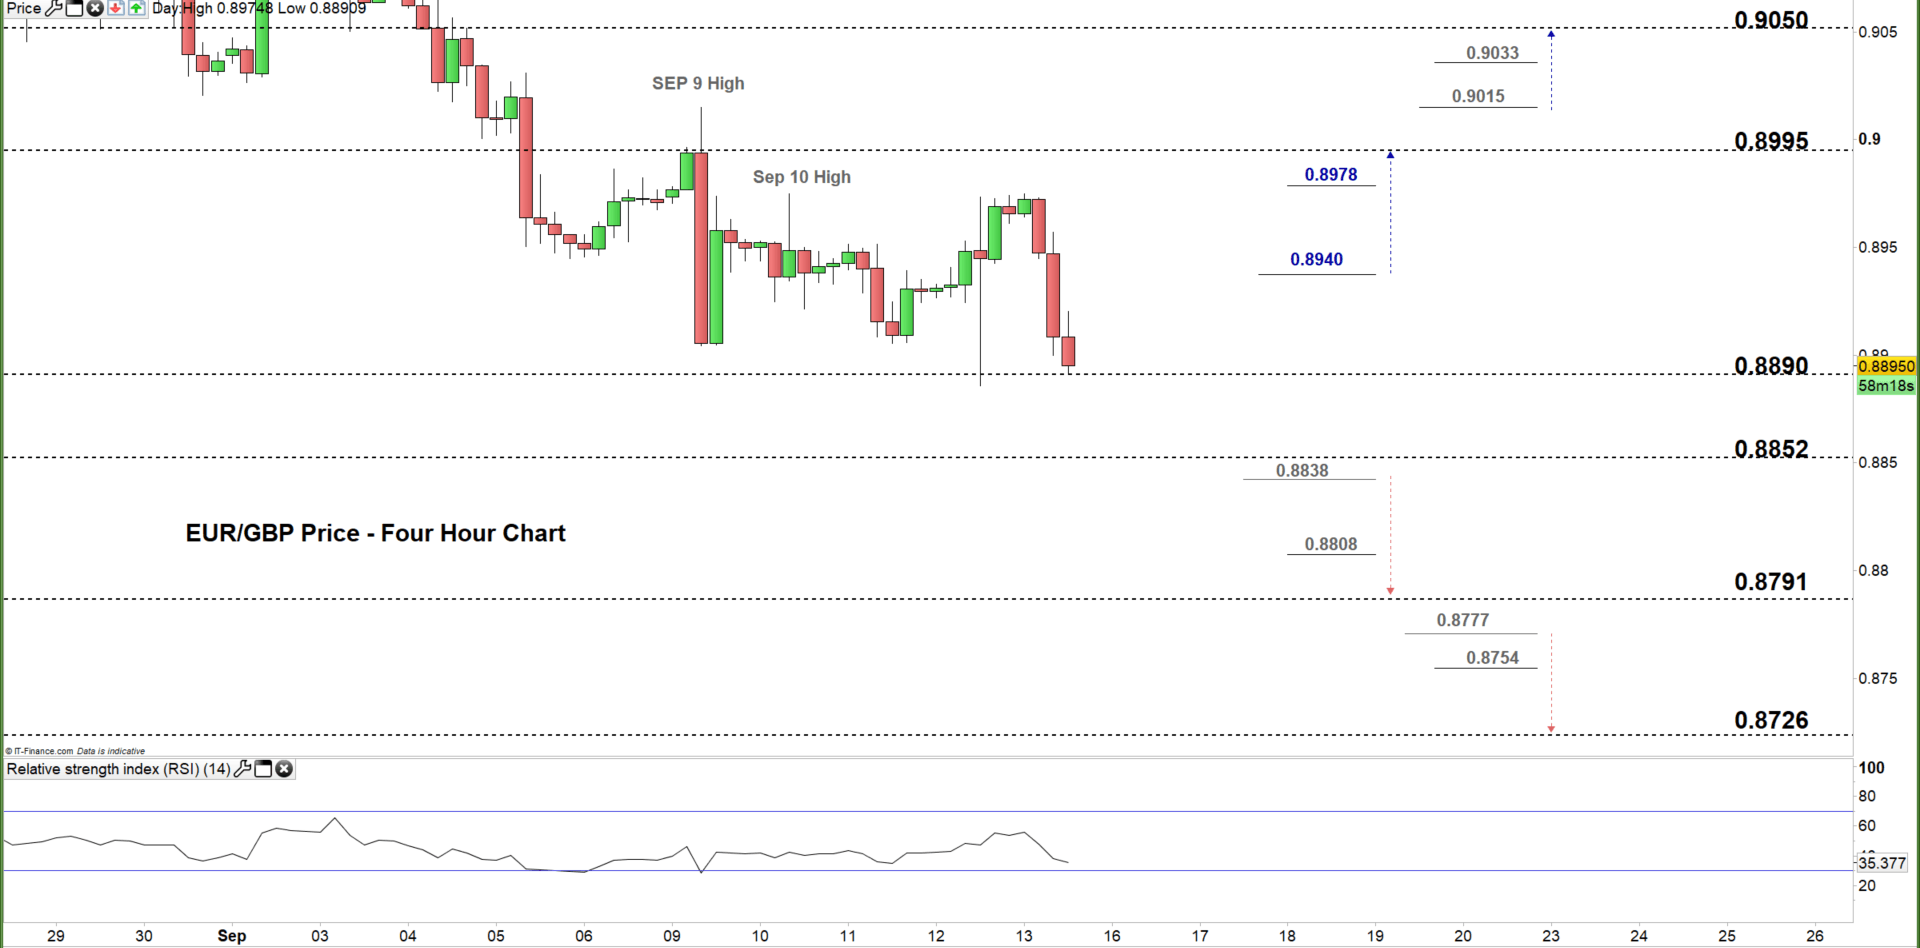
From the four-hour chart, we notice yesterday EUR/GBP found resistance at 0.8974 - the Sep 10 high then declined and rebounded at the low end of the aforementioned trading zone.
Hence, a break above 0.8838 could send EURGBP towards 0.8791. Although, the weekly support level underlined on the chart should be considered. See the chart to know more about lower support levels the price would encounter in a further bearish move.
On the other hand, a break above 0.8940 may push EUR/GBP towards the high end of current trading zone. Nonetheless, the daily resistance level underscored on the chart needs to be watched closely. See the chart to find out more about higher resistance levels the pair would face in a further bullish move.
Written By: Mahmoud Alkudsi
Please feel free to contact me on Twitter: @Malkudsi