
Wall Street, Dow Jones, S&P 500, Nasdaq Composite – Asia Pacific Market Open
- Market sentiment recovered into Friday’s Wall Street close
- Trump presser on China underwhelmed escalation worries
- Dow Jones, S&P 500, Nasdaq Composite eyeing more highs?
The Dow Jones, S&P 500 and Nasdaq Composite soared into Friday’s close after temporarily trading in the red. The former still ended the day -0.07% while the latter two closed +0.48% and +1.29% respectively. This turnaround in sentiment weighed against the anti-risk Japanese Yen while the growth-linked Australian Dollar followed the rise in global equities.
For most of Friday, investors were anxiously awaiting President Donald Trump’s news conference on China. This was in response to the latter endorsing a proposed security law for Hong Kong. In fact, sentiment deteriorated during morning North American trade as the White House weighed sanctions against China’s finance sector. Perhaps fears that the Trump administration could also levy tariffs worried traders.
Ultimately it seemed that the worst-case scenario priced in by markets was avoided, for now. For one thing, reports crossed the wires that Trump was not planning on quitting the phase-one trade deal. He formerly announced that the country would revoke Hong Kong’s preferential treatment status. Stock markets cheered his presser, sinking the haven-oriented US Dollar.
Monday’s Asia Pacific Trading Session
With that in mind, Asia Pacific equities could follow Wall Street’s rosy lead to start off the new trading week. Gains in Japan’s benchmark Nikkei 225 and Australia’s ASX 200 may offer support for the Australian Dollar and New Zealand Dollar.
This could come at the expense of the US Dollar and Japanese Yen. Caixin China manufacturing PMI (May) will cross the wires later today. The data could reveal further insight into how the economic recovery is unfolding in the world’s second-largest economy.
Wall Street Technical Analysis
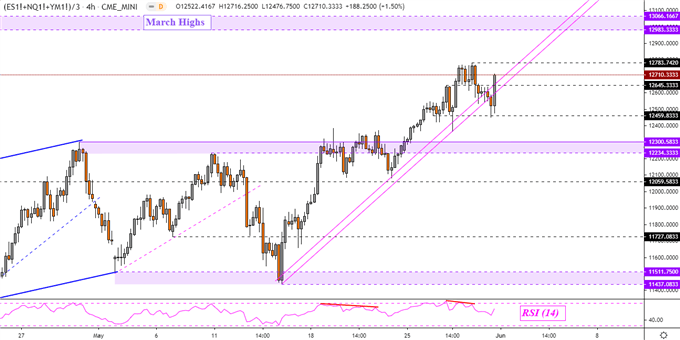
Below is a 4-hour chart of my Wall Street index which averages Dow Jones, S&P 500 and Nasdaq Composite futures. Prices failed to confirm a breakout under key rising support from the middle of May – pink lines. This leaves the index facing peaks from last week as US equities, on average, attempt to push towards highs from March. Keep an eye on RSI which could reveal negative divergence, a sign of fading momentum.
Wall Street Index – 4-Hour Chart
--- Written by Daniel Dubrovsky, Currency Analyst for DailyFX.com
To contact Daniel, use the comments section below or @ddubrovskyFX on Twitter