
DJIA Momentum Diverges From Price

Dow Jones Industrial Average is trying to finish the week on a higher note as it is up fractionally since last Friday. The DJIA is drifting higher for the past week, momentum oscillators and Elliott Wave models are flashing yellow lights.
In our previous report we shared how a cluster of wave relationships and trend channels are converging near the current DJIA price level. DJIA appears to be respecting these levels as price has been unable to punch materially higher.
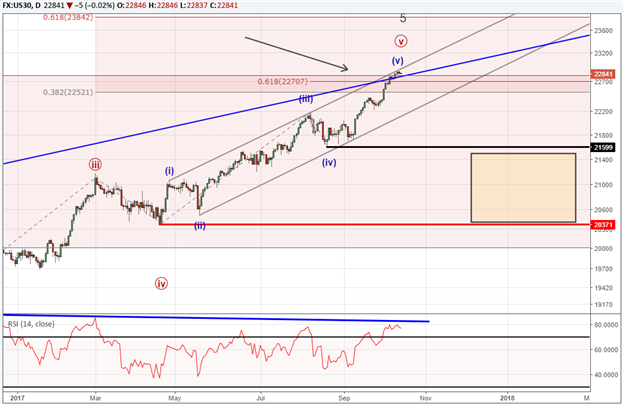
Oscillators, such as the Relative Strength Index (RSI) are diverging with previous DJIA price peaks indicating momentum is slowing and possibly at risk of a reversal.
Wave (v) is painting a compelling picture of at least a shorter term correction. When you connect wave (ii) and wave (iv) with a trend line and duplicate it to the top of wave (iii), many times wave (v) reaches the top of that channel. That is where DJIA is currently parked so the odds of a reversal or increasing.
In situations like these, traders look to tighten up risk levels or lighten exposure in the market in case of a correction. We feel like there are two compelling patterns to keep an eye on. One is a deep reversal and the second is a more shallow reversal to 20,371 to 21,600.
Bottom line, the current trend is still considered higher so we are not looking to position short. We are seeing yellow lights flashing so look to tighten risk and begin to identify bearish patterns if they print.
The DJIA trend is quite mature so have an exit plan ready before you enter. Read other traits we found of successful traders here.
Want to learn more about Elliott Wave analysis? Grab the Beginner and Advanced Elliott Wave guides.
---Written by Jeremy Wagner, CEWA-M
Discuss this market with Jeremy in Monday’s US Opening Bell webinar.
Follow on twitter @JWagnerFXTrader .
Recent Elliott Wave articles by Jeremy:
EURUSD pattern looks to be attracted to 1.20.
Gold prices may find temporary relief.
DJIA doesn’t look like the only market with a big reversal nearby. GBPUSD approaches an important long term price zone too.
USDJPY Advance May Kick Off a New Uptrend
Elliott Wave Patterns: What is a Zigzag? (Educational)
3 Elliott Wave Flat Patterns to Know and Understand (Educational)
Other Elliott Wave resources include one hour webinar recordings on the specific patterns:
Elliott Wave Impulse Patterns
Elliott Wave Zigzag Patterns
Elliott Wave Flat Patterns
Elliott Wave Triangle Patterns
Elliott Wave Diagonal Patterns
Starting Your Elliott Wave Counting
Challenges And Rewards Of Expat Life In Asia
The freedoms, novelties, and richness of new experiences that typify the expat way of living constitute the crux of the ... Read more
NZD/USD Wedge Breakout Back In Play As US Dollar Strength Cools
NZD/USD is looking higher ahead of Australian and New Zealand inflation expectations. Meanwhile, China's credit conditio... Read more
Australian Dollar Outlook: AUD/USD Eyes Westpac Consumer Confidence
The Australian Dollar is seeing a mild rebound following a Rising Wedge breakdown. AUD/USD may see volatility on Westpac... Read more
NZD/USD May Weaken As Goldman Sachs Downgrades Chinese Growth Outlook
The New Zealand Dollar fell overnight against the US Dollar as Covid and Chinese economic downgrades weighed on sentimen... Read more
AUD/USD Threatens Key Technical Level As Chinese Inflation Data Nears
AUD/USD is threatening a breakdown as prices test support at the floor of a Rising Wedge chart pattern. Chinese inflatio... Read more
Australian Dollar Forecast: AUD/USD May Move On RBA, Covid, China, US NFPs
The Australian Dollar is benefiting from a rebound in sentiment after Wall Street closed higher. AUD/USD looks to the RB... Read more