
Crude Oil Prices Reach Highest Level Since July 2015 - How Much Farther?

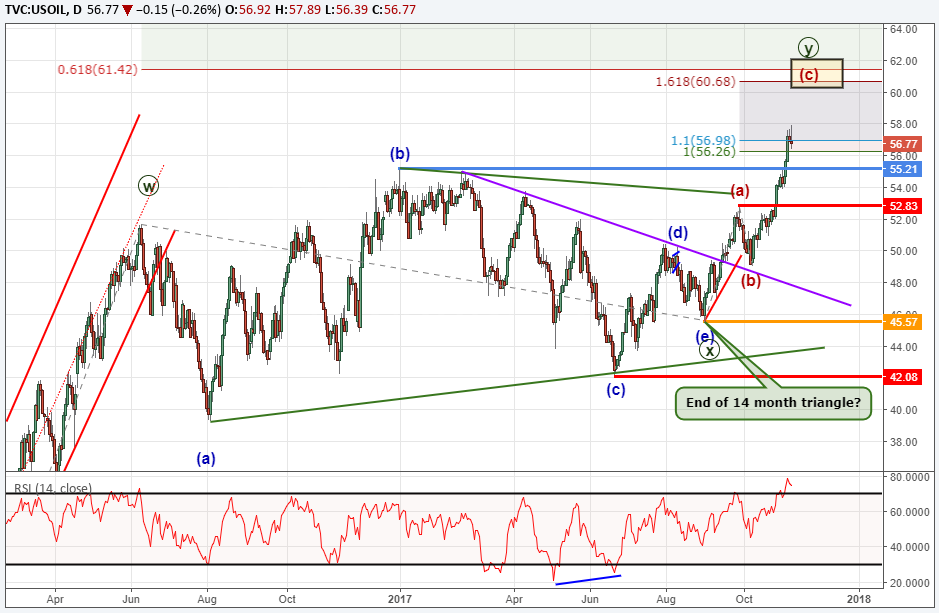
Crude oil prices have finally broken above its two year price range to reach its highest level since July 2015. The sideways consolidation in crude oil charts best as a sideways triangle consolidation.
The Elliott Wave model we have been following has anticipated the bullish triangle and that crude oil may see further strength. The model notes the triangle terminated on August 31, 2017 and that the triangle was an ‘X’ wave of a W-X-Y wave. Therefore, the break higher suggests we are in the ‘Y’ wave. The ‘Y’ wave can take a couple different forms. The most likely form would be a zigzag.
There are a few guidelines to the formation of a zigzag. At today’s high, one possibility is that crude oil satisfied minimum requirements for this zigzag. If that pattern holds, then crude oil may be on the front edges of a long decline back towards the 2016 lows.
We are not certain of those odds. The momentum has been strong to the upside so we need to be mindful that crude oil prices may continue to work higher. The next wave relationship comes in near $61 per barrel. If price does continue higher, look for a stronger reaction to take place near $60.70 to $61.50.
Bottom line, we are in a terminal or ending wave of a two year sequence. If crude oil prices continue to shoot higher, look for stronger resistance to form near $61 per barrel.
Struggling with your trading? You could be making this common trading mistake.
---Written by Jeremy Wagner, CEWA-M
Jeremy is a Certified Elliott Wave Analyst with a Master’s designation. For more learning material on Elliott Wave theory, consider the following:
Beginner and Advanced Guides on Trading with Elliott Wave
Learn more on triangle patterns by viewing this hour-long webinar recording on how to identify and trade triangles...registration required.
Discuss this market with Jeremy in Monday’s US Opening Bell webinar.
Follow on twitter @JWagnerFXTrader .
Join Jeremy’s distribution list.
Other Elliott Wave forecasts by Jeremy:
Short term EURUSD Pattern Hints at Bounce to 1.17.
Gold price forecast points towards lower levels.
NZDUSD Elliott Wave Analysis: Temporary Relief Rallies
USD/JPY stalls but holds above support.
Price action analysis for AUDUSD, NZDUSD, EURUSD [Webinar recording]
Challenges And Rewards Of Expat Life In Asia
The freedoms, novelties, and richness of new experiences that typify the expat way of living constitute the crux of the ... Read more
NZD/USD Wedge Breakout Back In Play As US Dollar Strength Cools
NZD/USD is looking higher ahead of Australian and New Zealand inflation expectations. Meanwhile, China's credit conditio... Read more
Australian Dollar Outlook: AUD/USD Eyes Westpac Consumer Confidence
The Australian Dollar is seeing a mild rebound following a Rising Wedge breakdown. AUD/USD may see volatility on Westpac... Read more
NZD/USD May Weaken As Goldman Sachs Downgrades Chinese Growth Outlook
The New Zealand Dollar fell overnight against the US Dollar as Covid and Chinese economic downgrades weighed on sentimen... Read more
AUD/USD Threatens Key Technical Level As Chinese Inflation Data Nears
AUD/USD is threatening a breakdown as prices test support at the floor of a Rising Wedge chart pattern. Chinese inflatio... Read more
Australian Dollar Forecast: AUD/USD May Move On RBA, Covid, China, US NFPs
The Australian Dollar is benefiting from a rebound in sentiment after Wall Street closed higher. AUD/USD looks to the RB... Read more