
Crude Oil And Natural Gas Prices Grind Higher - How Much Further?

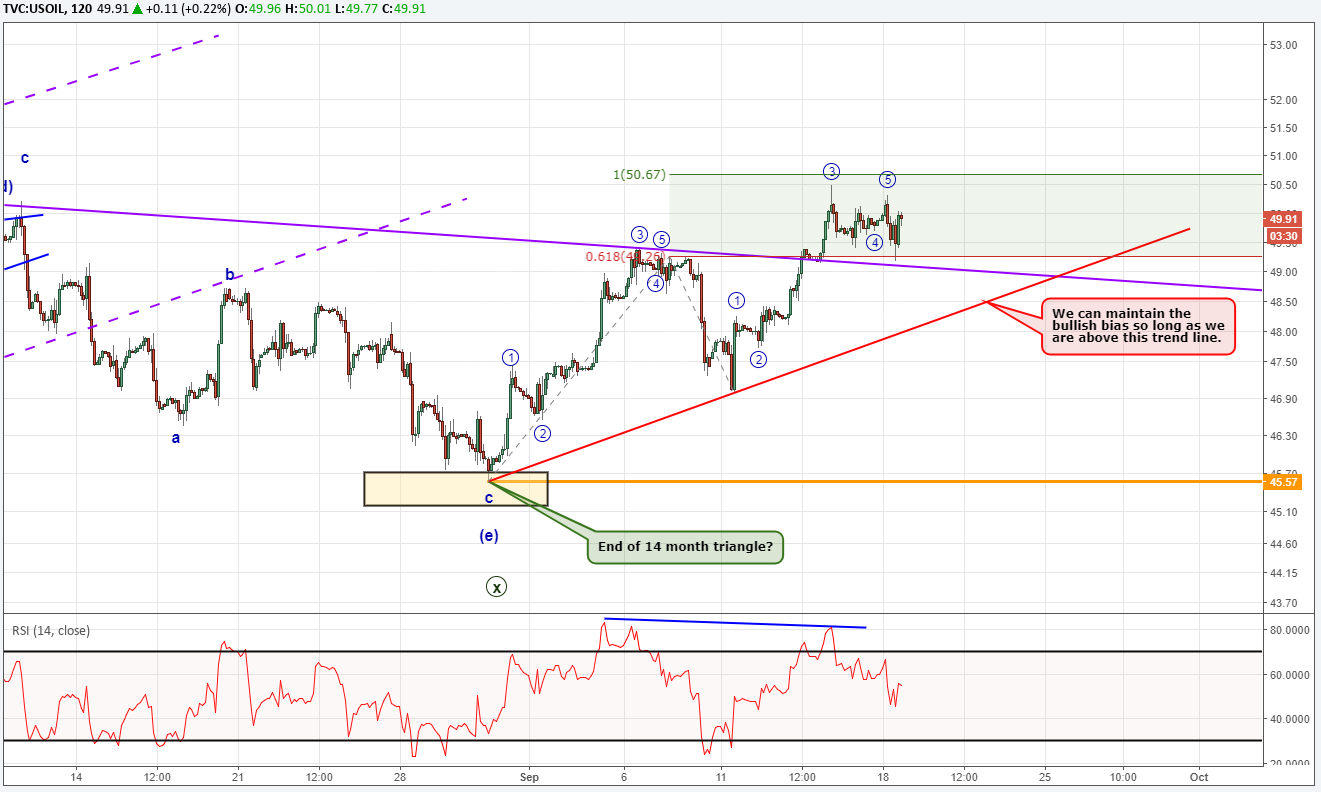
Crude oil prices have been pressing the higher end of its trading range for the past two weeks. We previously wrote how we think the 14 month triangle pattern may have ended on August 30. If so, this is a likely a bullish triangle leading towards a retest of $55 and possibly higher.
According to the Elliott Wave model we are following, we can count five wave impulsive moves higher, though they are not the cleanest. Therefore, we need to keep an open mind that the pattern is illustrating an inability to punch higher with vigor. This in itself is weak so stick to your technical levels and if they break, move on to other patterns.
The key level to watch here is the red upward sloping trend line. So long as prices remain above this trend line, then we can maintain a bullish bias. The red trend line runs near $48 today. If crude oil prices move below this red trend line, then it acts like a red warning signal on the dashboard. There are still bullish patterns available like a diagonal. However, the odds of other bearish patterns increases diluting the opportunity at a good risk to reward ratio. Bottom line, a break of the red trend line opens the door for a retest of the August 30 low at $45.57.
Struggling with your trading? You could be making this common trading mistake.
Crude Oil Price Intraday Chart
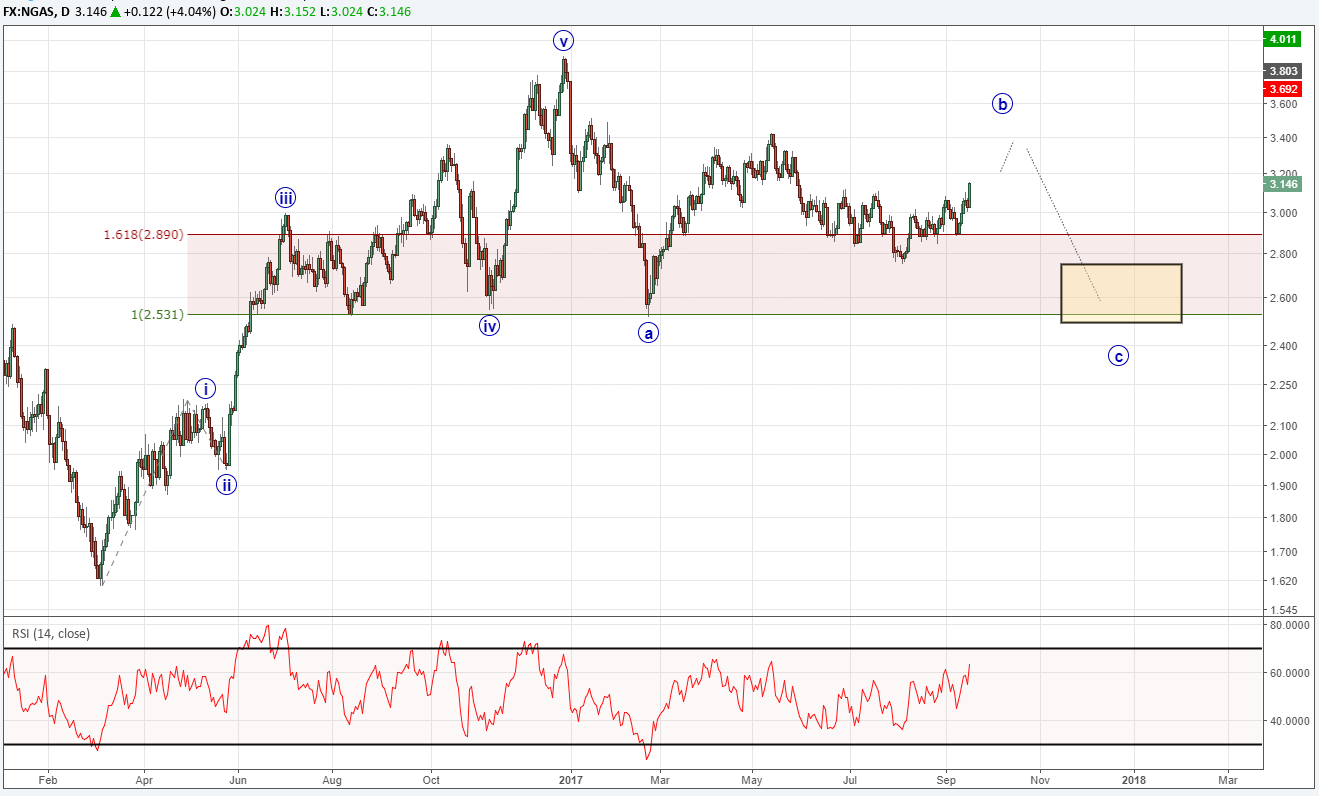
Bonus chart:
Natural gas prices have been trading in a quiet range for most of 2017 (similar to crude oil). We anticipate the trading range may continue for the next several months. However, we want to put this on your radar that a dip towards 2.60 may dig deep enough to offer bulls a longer term possibility.
You see, natural gas prices began an impulsive move to start a new trend and is currently correcting sideways. It appears natural gas is moving higher in the ‘b’ wave of a bigger downward correction. Once this larger move down is finished, we will look for signs of a bottom.
Natural Gas Daily Chart
---Written by Jeremy Wagner, CEWA-M
Jeremy is a Certified Elliott Wave Analyst with a Master’s designation. For more learning material on Elliott Wave theory, consider the following:
Beginner and Advanced Guides on Trading with Elliott Wave
Learn more on triangle patterns by viewing this hour-long webinar recording on how to identify and trade triangles...registration required.
Discuss this market with Jeremy in Monday’s US Opening Bell webinar.
Follow on twitter @JWagnerFXTrader .
Join Jeremy’s distribution list.
USDJPY Advance May Kick off a New Uptrend
US Opening Bell Webinar archive (Sept 18)
Challenges And Rewards Of Expat Life In Asia
The freedoms, novelties, and richness of new experiences that typify the expat way of living constitute the crux of the ... Read more
NZD/USD Wedge Breakout Back In Play As US Dollar Strength Cools
NZD/USD is looking higher ahead of Australian and New Zealand inflation expectations. Meanwhile, China's credit conditio... Read more
Australian Dollar Outlook: AUD/USD Eyes Westpac Consumer Confidence
The Australian Dollar is seeing a mild rebound following a Rising Wedge breakdown. AUD/USD may see volatility on Westpac... Read more
NZD/USD May Weaken As Goldman Sachs Downgrades Chinese Growth Outlook
The New Zealand Dollar fell overnight against the US Dollar as Covid and Chinese economic downgrades weighed on sentimen... Read more
AUD/USD Threatens Key Technical Level As Chinese Inflation Data Nears
AUD/USD is threatening a breakdown as prices test support at the floor of a Rising Wedge chart pattern. Chinese inflatio... Read more
Australian Dollar Forecast: AUD/USD May Move On RBA, Covid, China, US NFPs
The Australian Dollar is benefiting from a rebound in sentiment after Wall Street closed higher. AUD/USD looks to the RB... Read more