Nasdaq Technical Outlook:
- Nasdaq Composite 10k could be an important turning point
- It’s not just psychological, there is a line of resistance matching
Nasdaq Composite 10k could be an important turning point
As the Nasdaq Composite approaches 10,000, I can’t help but think back to the first time the Nasdaq hit 5,000 in March 2000. Just before it collapsed. This time around things certainly aren’t moving at the clip they were then; the Nasdaq at that time shot up from 4k to just over 5k (~25%) in about 3-months’ time. We aren’t seeing that type of manic price action these days.
But that doesn’t mean the market isn’t exhibiting plenty of signs of froth. Many valuation metrics are at historically high levels. For example, the popular Shiller PE Ratio is over 31, topping the 1929 reading, and only exceeded by the level registered in 2000 when it neared 45. Looking at the IPO market, approximately 70-80% of companies that went public this year aren’t profitable. The highest number of ‘losing’ companies to do so since Tech Bubble 1.0. This is a good sign that investors have turned their back on reason.
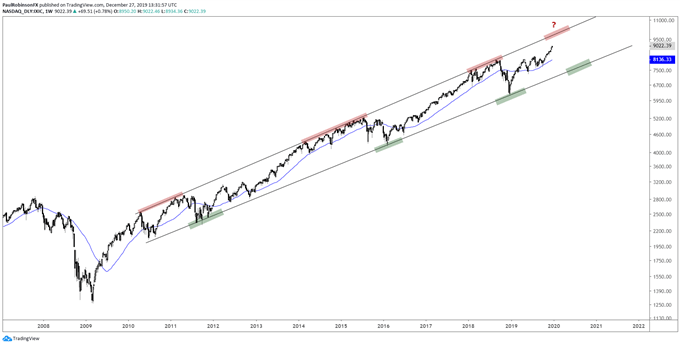
However, these frothy, overvalued situations can go on for a while (as we have seen). Valuation metrics make for terrible timing tools. The long-term chart of the Nasdaq offers a couple of things. The trend is clearly up, with it held nicely within the confines of a channel dating back to the early days of the bull market. As long as price stays above the lower parallel then the big-picture trend remains pointed higher. Drop below, then we can discuss the possibility of an extended bear market.
This doesn’t mean there won’t even within this structure that there won’t be any sharp drops and shorting opportunities. As the market zooms higher not only is the 10k level in sight, but it aligns fairly well with the upper parallel of the long-term bull channel. It was this upper parallel that marked a top back in 2018. It could indeed do it again in 2020.
If this is the case, to fall from the upper parallel to the lower parallel the Nasdaq would decline 20-25%, and it would still be inside the long-term bullish channel. With a decline of that magnitude there would be plenty of shorting opportunities and volatility for short to intermediate-term traders. It could even be a dip-trip opportunity for long-term bulls. We’ll have to see how things play out should the above unfold.
What will help favor the topping scenario is if the market keeps rising to start the year, even accelerating towards loftier levels. An accelerated move would be a strong sign that the market is in a blow-off phase. If this is the case, keep an eye on how price action plays out should the 10k/upper parallel be met. A volatile turnabout would be a sign that a top is in the works and that traders will need to switch gears. Perhaps it will only be for a few months, but it could also turn into something much longer. As they say, “we shall see.”
Nasdaq Composite Weekly Chart (10k, Upper Parallel)

To learn more about U.S. indices, check out “The Difference between Dow, Nasdaq, and S&P 500: Major Facts & Opportunities.” You can join me every Wednesday at 1030 GMT for live analysis on equity indices and commodities, and for the remaining roster of live events, check out the webinar calendar.
Tools for Forex & CFD Traders
Whether you are a beginning or experienced trader, DailyFX has several resources available to help you; indicator for tracking trader sentiment, quarterly trading forecasts, analytical and educational webinars held daily, trading guides to help you improve trading performance, and one specifically for those who are new to forex.
---Written by Paul Robinson, Market Analyst
You can follow Paul on Twitter at @PaulRobinsonFX

