
Bitcoin Elliott Wave Forecasts Near Term Support Of Prices

The Bitcoin Elliott Wave forecast suggests that shorter-term bullish patterns may emerge to drive the cryptocurrency back up to $11,600.
Bitcoin Elliott Wave Analysis Talking Points:
- Bitcoin prices have been rallied from the 6,500 low in an impulse wave
- When an impulse wave starts a new trend, we anticipate a partial retracement followed by another bullish wave of similar size
- Above 7,800 anticipate a recovery up to 11,600
Bitcoin prices have been falling since the December 2017 high. Though we cannot say for sure if the multi-month correction is over, the rally that began on April 6 has taken the shape of a bullish impulse wave. Therefore, we know from our studies of Elliott Wave Theory that an impulse wave that begins a new trend typically means we are witnessing the beginning of a zigzag pattern or a larger degree impulse wave. In both scenarios, it is a high probability we see a partial retracement followed by another rally of similar size or Fibonacci proportions to the first wave.
Fibonacci partial retracement
The first movement we are looking for after the impulse wave rally is a partial retracement and correction lower of the uptrend. The most common way to get started in estimating the retracement level is using the Fibonacci retracement tool.
Therefore, we are looking for Bitcoin prices to dip, but most likely hold above 7,800. It is possible the correction lower is over and the secondary rally may be commencing soon.
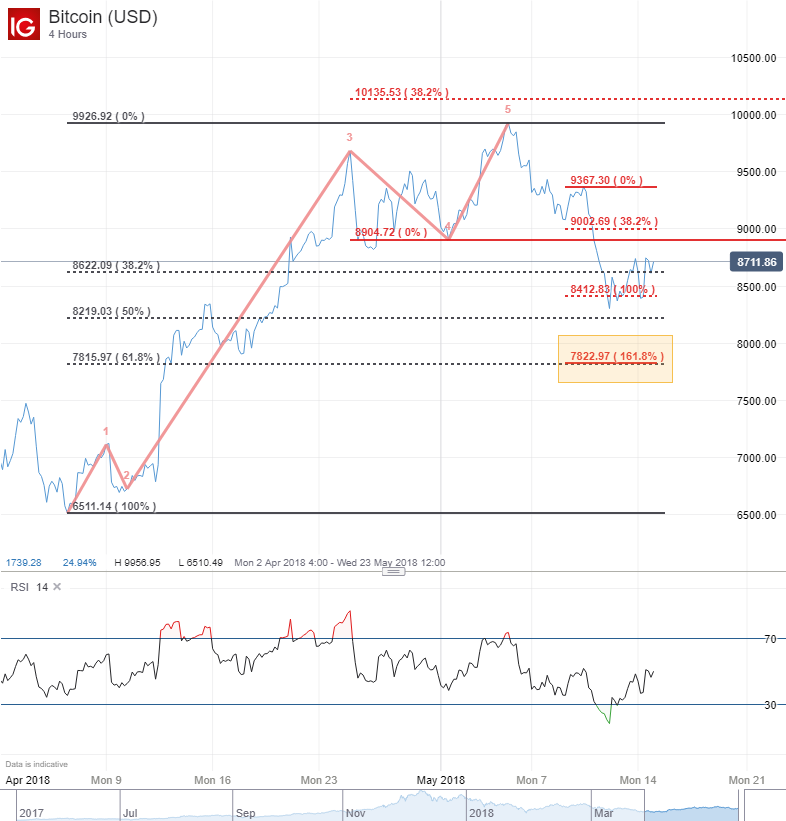
Bitcoin chart target levels
Since the first wave measured 3,415, we look for the next wave to measure a similar distance pushing it up towards 11,600. The key level to this cryptocurrency forecast is the April 6 low of 6,511.
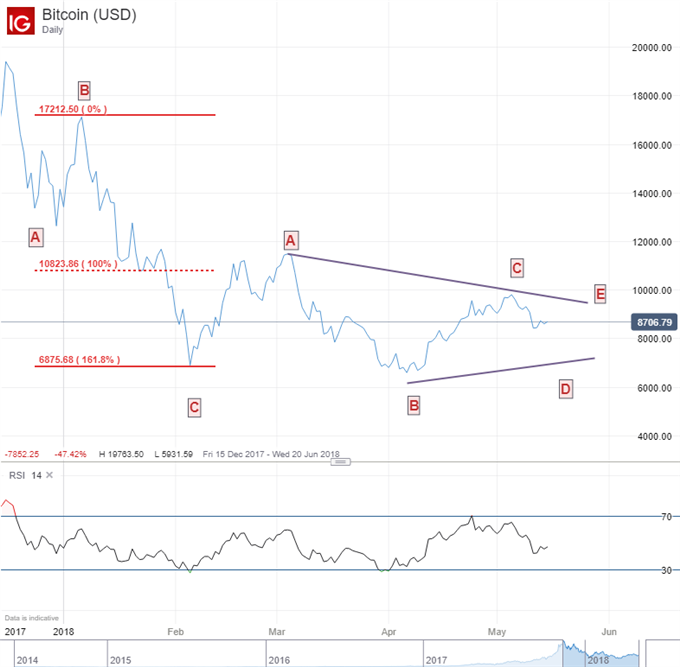
Alternate Elliott Wave Forecast
If Bitcoin prices are unable to rally, one alternative chart we are considering is that a large Elliott Wave triangle is unfolding. Under this scenario, the Bitcoin chart level of 9,927 likely holds prices down as the market continues in a sideways grind. Triangles can appear in the bullish and bearish sequence. In this instance it could be a bearish triangle wave unfolding.
Bitcoin Elliott Wave FAQs
What is Elliott Wave Theory?
Elliott Wave Theory is a forex trading study that identifies the highs and lows of price movements on charts via wave patterns. Traders often analyze the 5-wave impulse sequence and 3-wave corrective sequence to help them trade strategically. We cover these wave sequences in our beginners and advanced Elliott Wave trading guides.
Does the Elliott Wave principle work on cryptocurrencies?
We think it does. Elliott Wave is a study of the waves, which are reflective of the mass psychology of the market. Right now, we think the mass psychology on Bitcoin and other altcoins diminishing. Any large market with a mass of humans behind it can be analyzed using Elliott Wave Theory. If you are new to Bitcoin, we have an introductory guide to help you get started.
---Written by Jeremy Wagner, CEWA-M
Jeremy Wagner is a Certified Elliott Wave Analyst with a Master’s designation. Jeremy provides Elliott Wave analysis on key markets as well as Elliott Wave educational resources. Read more of Jeremy’s Elliott Wave reports via his bio page.
Communicate with Jeremy and have your shout below by posting in the comments area. Feel free to include your Elliott Wave count as well.
Follow on twitter @JWagnerFXTrader .
Recent Elliott Wave articles by Jeremy:
Gold Prices Bounce to Resistance while Dollar Index Corrects
Challenges And Rewards Of Expat Life In Asia
The freedoms, novelties, and richness of new experiences that typify the expat way of living constitute the crux of the ... Read more
NZD/USD Wedge Breakout Back In Play As US Dollar Strength Cools
NZD/USD is looking higher ahead of Australian and New Zealand inflation expectations. Meanwhile, China's credit conditio... Read more
Australian Dollar Outlook: AUD/USD Eyes Westpac Consumer Confidence
The Australian Dollar is seeing a mild rebound following a Rising Wedge breakdown. AUD/USD may see volatility on Westpac... Read more
NZD/USD May Weaken As Goldman Sachs Downgrades Chinese Growth Outlook
The New Zealand Dollar fell overnight against the US Dollar as Covid and Chinese economic downgrades weighed on sentimen... Read more
AUD/USD Threatens Key Technical Level As Chinese Inflation Data Nears
AUD/USD is threatening a breakdown as prices test support at the floor of a Rising Wedge chart pattern. Chinese inflatio... Read more
Australian Dollar Forecast: AUD/USD May Move On RBA, Covid, China, US NFPs
The Australian Dollar is benefiting from a rebound in sentiment after Wall Street closed higher. AUD/USD looks to the RB... Read more