

AUD/USD, NZD/USD Charts and Analysis
- US Dollar price action against Australian Dollar and New Zealand Dollar.
Did we get it right with our Gold and USD Dollar forecasts? Find out more for free from Q4 main currencies and commodities forecasts
AUD/USD, NZD/USD – Sellers May come back
Last week, US Dollar softened slightly against Australian and New Zealand Dollars. On Friday, AUD/USD closed in the green with a 0.3% gain. Meanwhile, NZD/USD closed with nearly 0.4% gain. However, since Monday sellers resumed pressing the price to the downside, hinting to a possible continuation of bearish price action.
The relative Strength Index (RSI) crossed below (50) on both pairs indicating to the end of buyer’s domination.
Having trouble with your trading strategy? Here’s the #1 Mistake That Traders Make
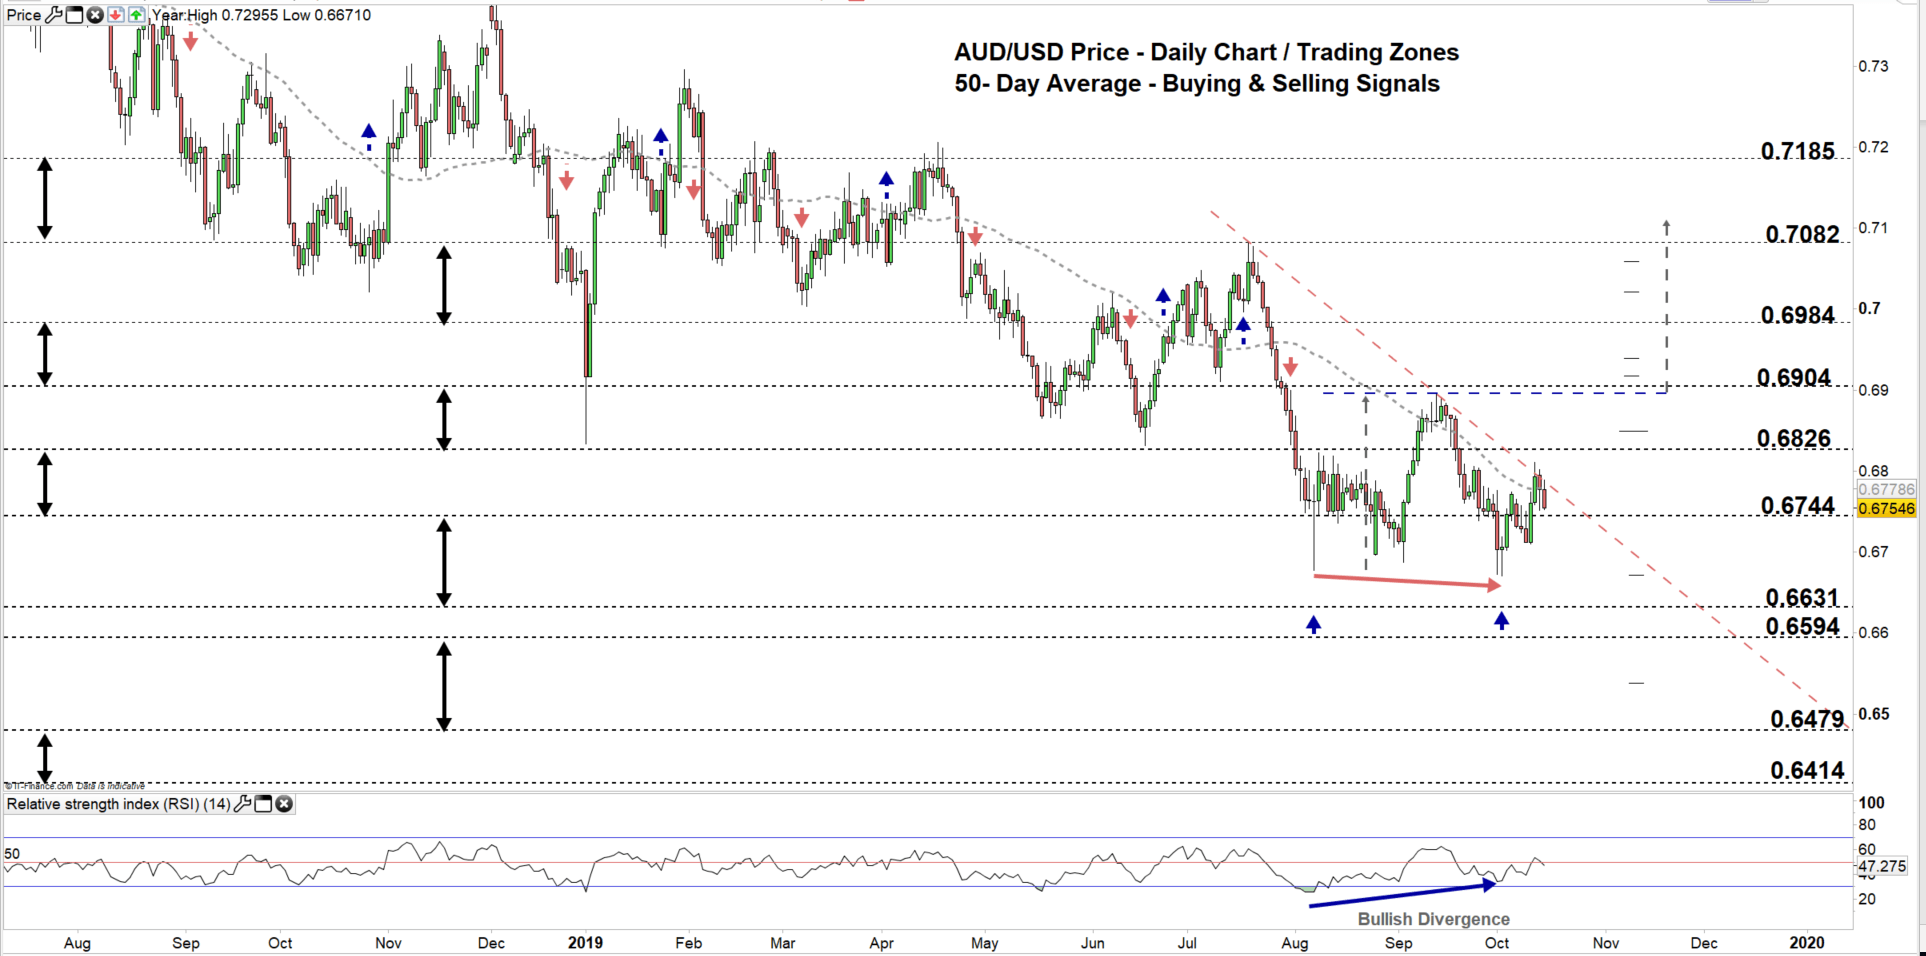
AUD/USD DAILY PRICE CHART (July 15, 2018 – Oct 15, 2019) Zoomed Out
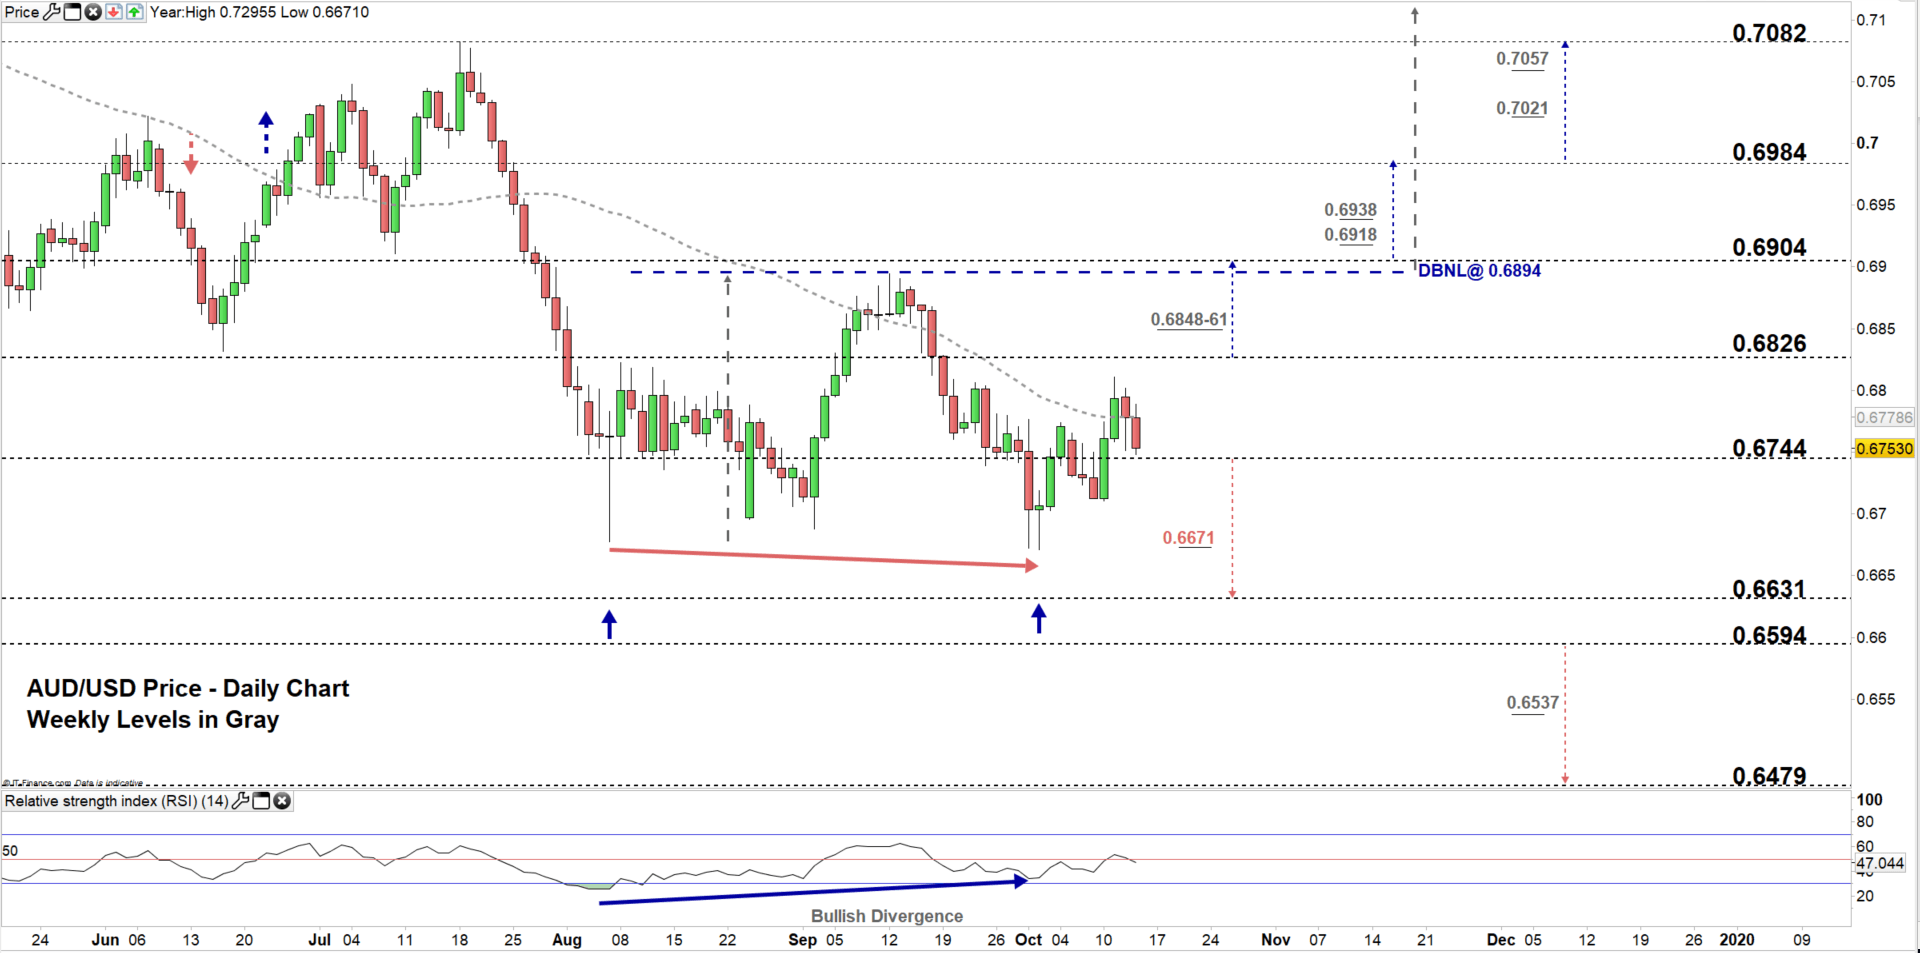
AUD/USD DAILY PRICE CHART (July 2 – Oct 15, 2019) Zoomed IN
Looking at the daily chart, we notice on Thursday AUD/USD rallied to a higher trading zone 0.6744- 0.6826. However, at the start of this week, the price declined eyeing a test of the low end of the zone.
Hence, a close below the low end could send AUDUSD towards 0.6631. Although, the Oct 2 low at 0.6671 should be monitored. Further close below this level may cause more bearishness towards 0.6594 then 0.6479 contingent on clearing the yearly support level underlined on the chart (zoomed in).
Having said that, any close above 0.6826 may increase the likelihood of testing the double bottom neckline located at 0.6894 . Although, the weekly resistance area marked on the chart would be worth monitoring.
If AUDUSD breaks and remains above the neckline, this could push the price towards 0.7000 handle and possibly above. However, the weekly resistance levels underscored on the chart should be kept in focus.
Just getting started? See our Beginners’ Guide for FX traders
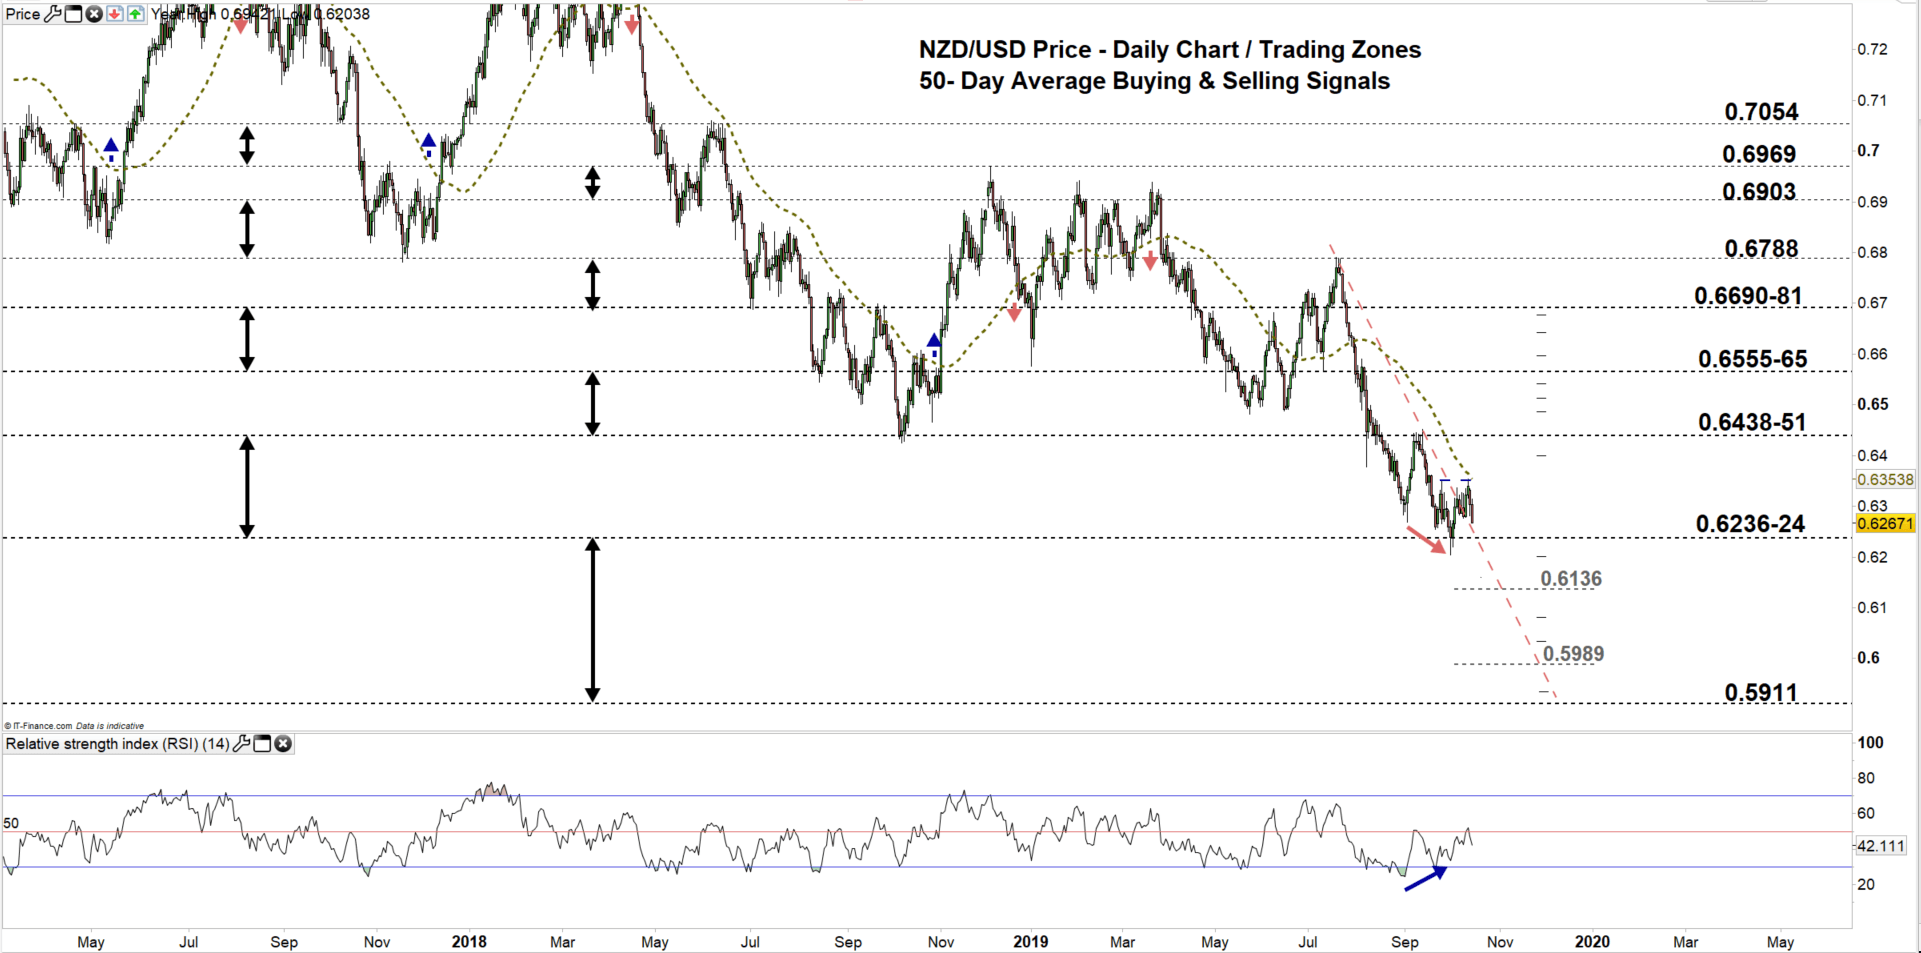
NZD/USD DAILY PRICE CHART (Mar 8, 2017 – Oct 15, 2019) Zoomed Out
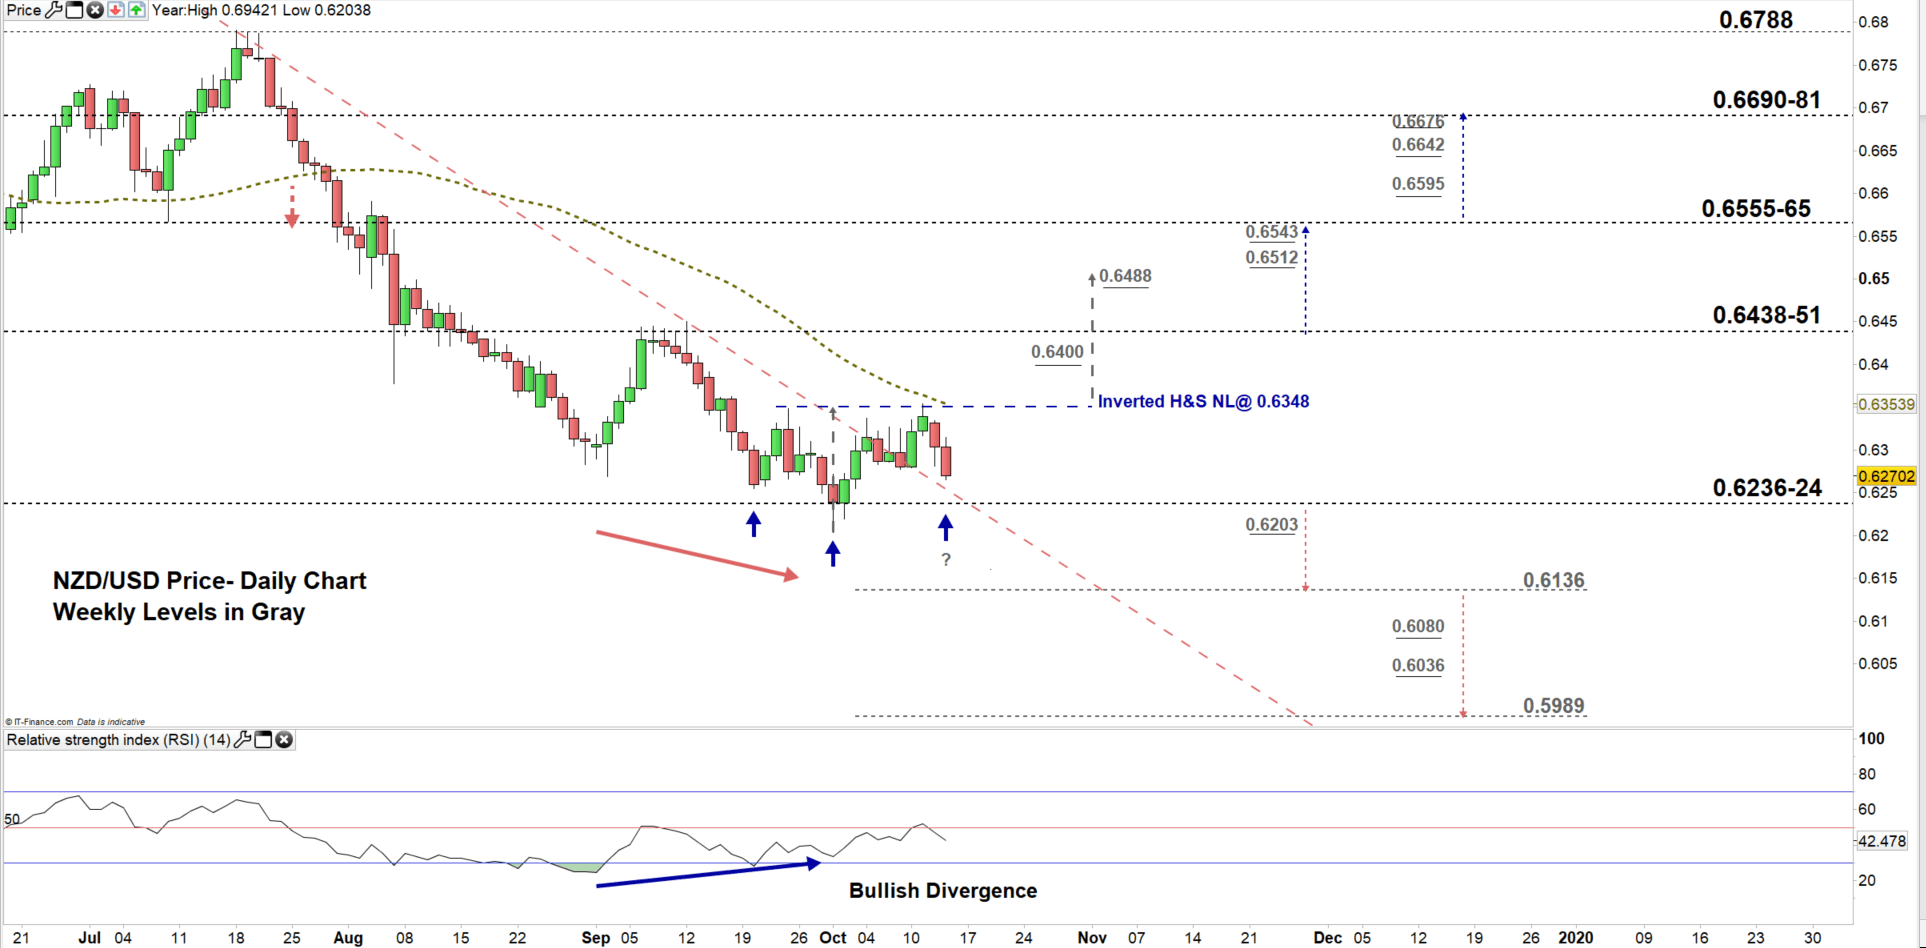
NZD/USD DAILY PRICE CHART (June 20 – Oct 15, 2019) Zoomed In
From the daily chart, we notice on Friday NZD/USD rallied to its highest level in over three weeks however, remained trading below 50-Day average. Since the start of this week, the price has been trading towards the low end of current trading zone 0.6236- 0.6438.
Hence, a close below the low end could press NZDUSD towards 0.6136. Further close below this level could see the price falling towards 0.5989. That said, the weekly support levels underlined on the chart (zoomed in) should be considered.
On the other hand, any failure in closing below the low end of the zone could reverse the pair’s direction and push it towards the high end of the zone. Although, the neckline of inverted head and shoulders pattern residing at 0.6348 with the weekly resistance level underscored on the chart should be watched closely.
See the chart to know more to any level the NZDUSD could rally, if breaks and remains above the aforementioned neckline.
Written By: Mahmoud Alkudsi
Please feel free to contact me on Twitter: @Malkudsi