

AUD/USD, NZD/USD Charts and Analysis
- US Dollar price action against Australian Dollar and New Zealand Dollar.
Did we get it right with our Gold and USD Dollar forecasts? Find out more for free from latest main currencies and commodities forecasts
AUD/USD, NZD/USD – Sellers in Charge
On Sep 12, AUD/USD spiked to 0.6894 - its highest level in six weeks. Since then buyers has not been able to rally the price above this level. This week, sellers took the initiative and pressed the price below 0.6800 handle.
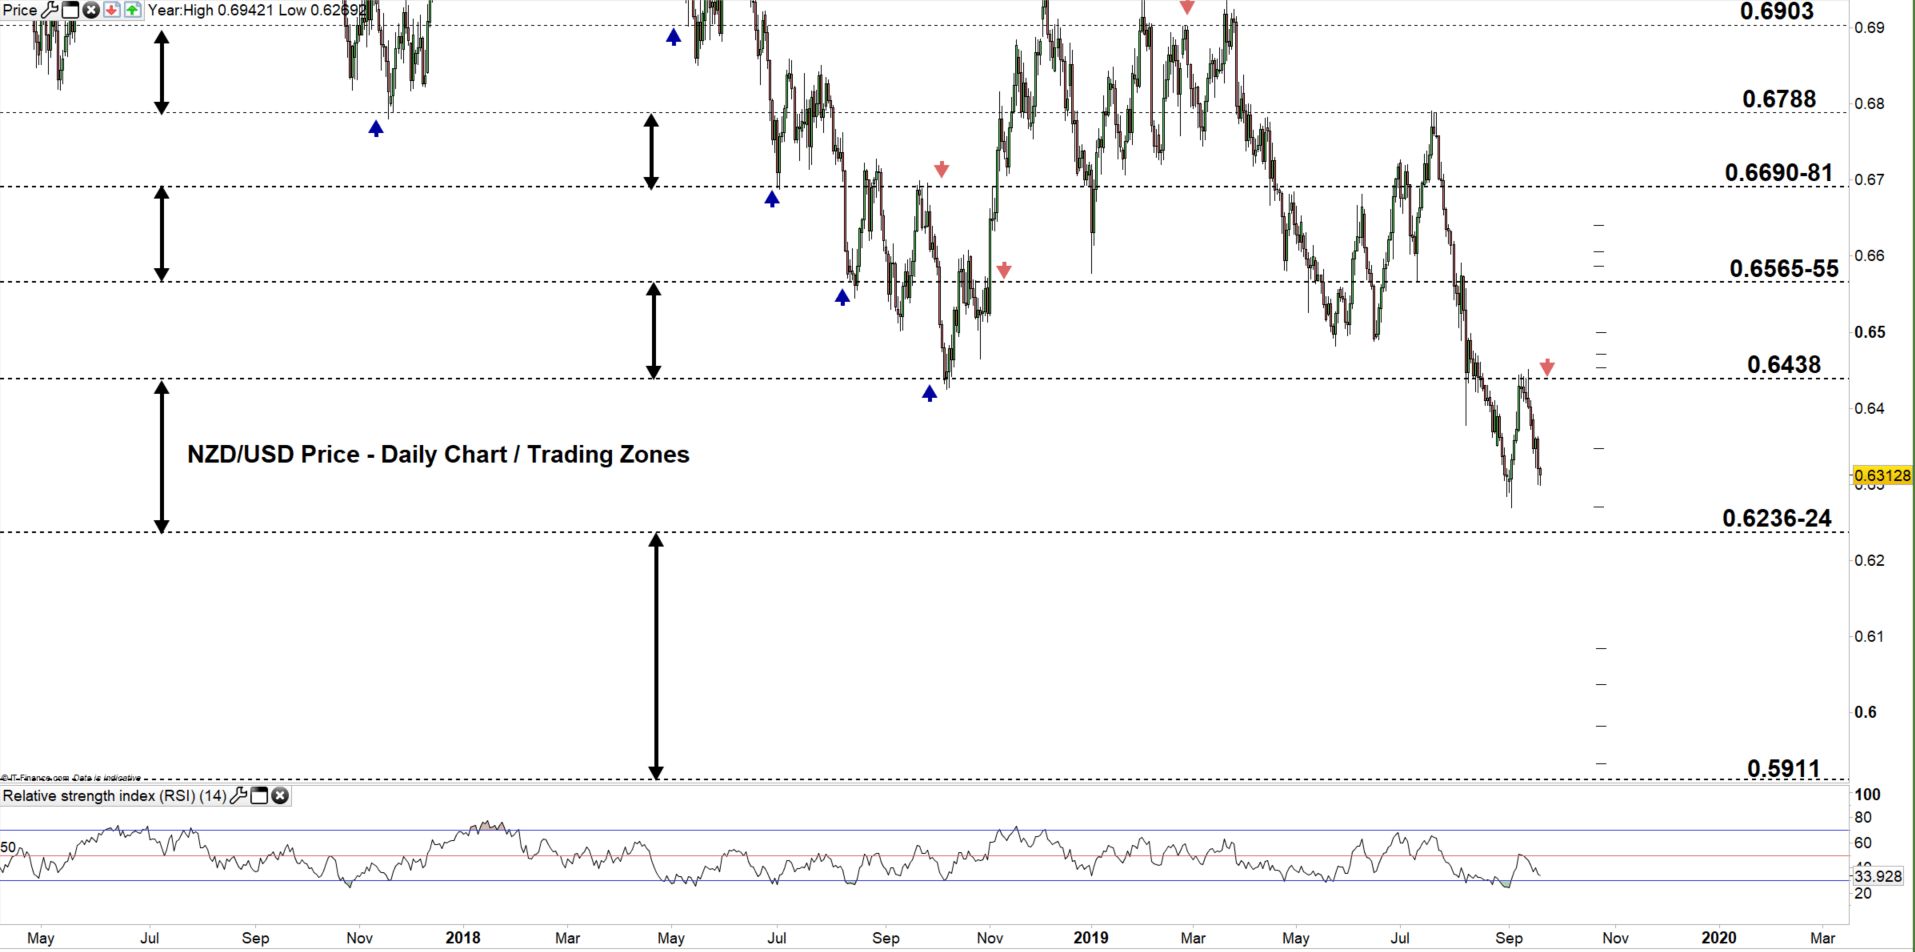
On the other hand, last week NZD/USD failed four times to clear 0.6438 - a key resistance level discussed in our last update. This week the pair declined and tested 0.6200 handle.
Alongside this, the Relative Strength Index (RSI) fell from 63 and crossed below 50 on AUD/USD reflecting a possible start of a fresh downtrend. The oscillator, failed to cross above 50 on NZD/USD then fell after, emphasizing the current downtrend was still intact.
Having trouble with your trading strategy? Here’s the #1 Mistake That Traders Make
AUD/USD DAILY PRICE CHART (July 15, 2018 – Sep 19, 2019) Zoomed Out

AUD/USD DAILY PRICE CHART (June 21 – Sep 19, 2019) Zoomed IN
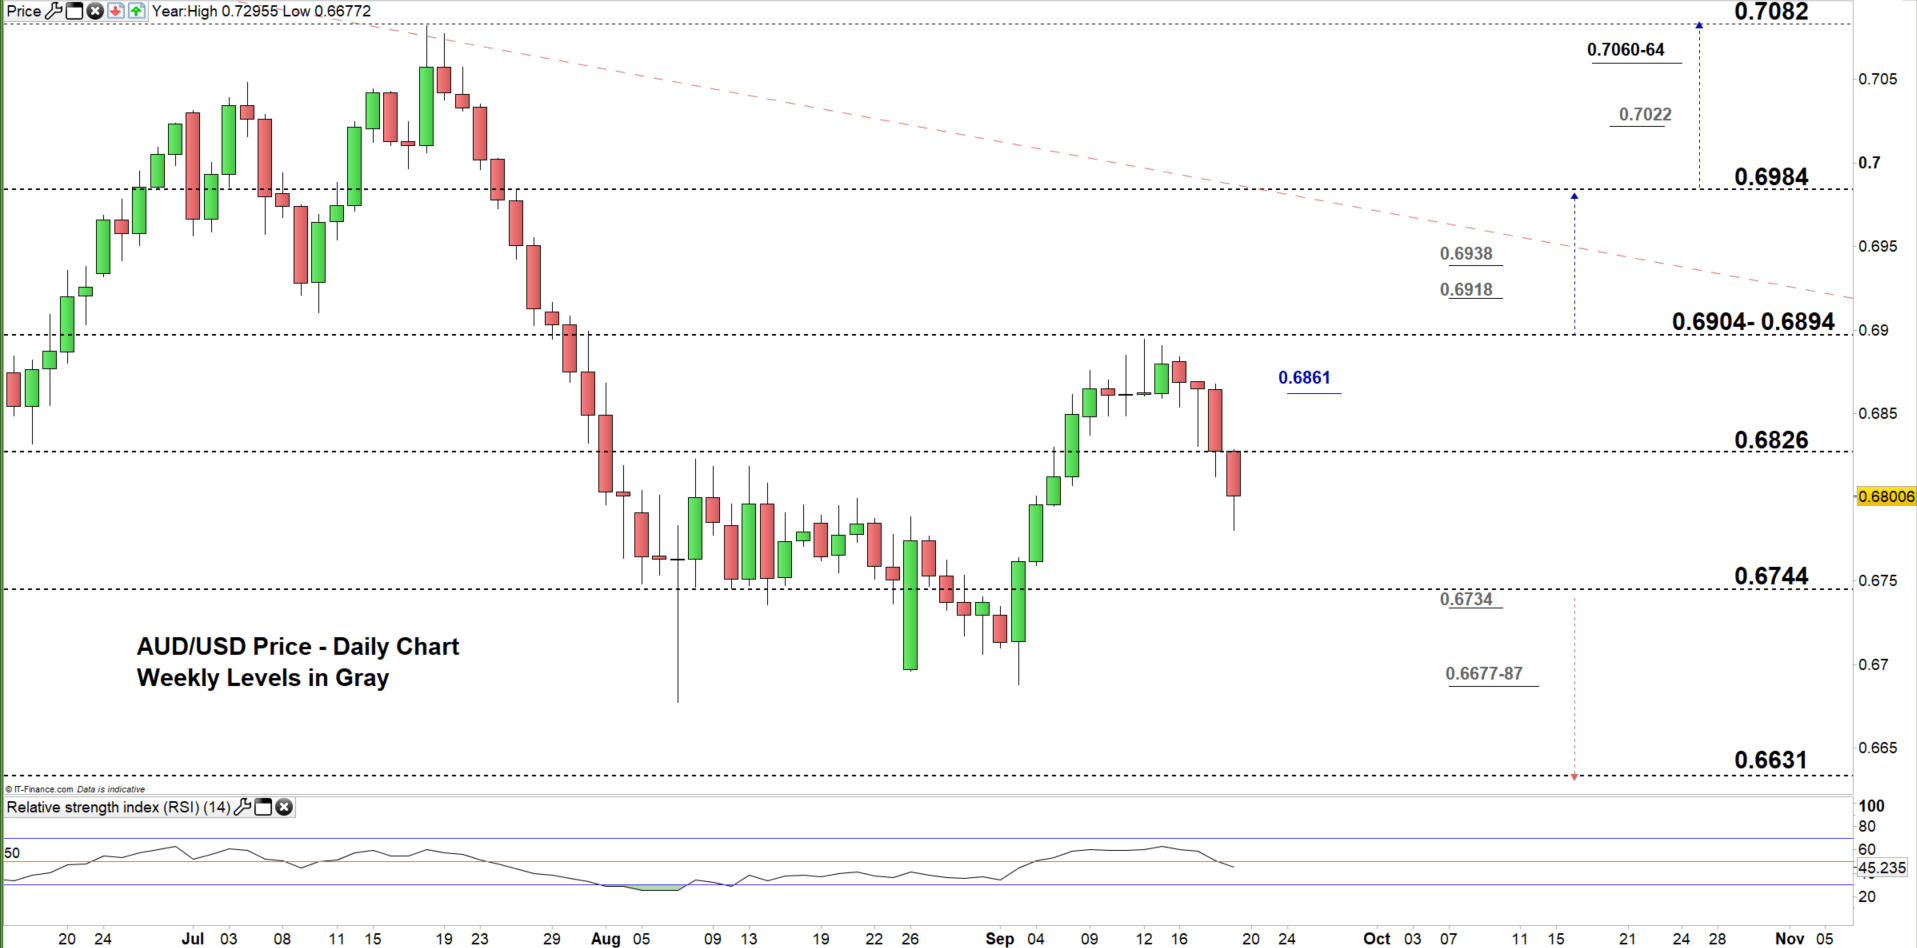
Looking at the daily chart, we notice yesterday AUD/USD tested a lower trading zone 0.6744 – 0.6826. Today, the price rebounded from the high end and currently looking for a test of the low end.
Hence, a close below the high end of the zone today could increase the likelihood of testing the low end of the zone. Further close below the low end may send AUDUSD towards 0.6631. Although, the weekly support levels underlined on the chart (zoomed in) would be worth monitoring.
In turn, a close above the high end of the zone could push the price towards 0.6894. Further close above 0.6904 might see AUDUSD trading even higher towards 0.6984. However, the daily and weekly resistance levels underscored on the chart should be kept in focus.
Just getting started? See our Beginners’ Guide for FX traders
NZD/USD DAILY PRICE CHART (April 15, 2017 – Sep 19, 2019) Zoomed Out
NZD/USD DAILY PRICE CHART (June 21 - Sep 19, 2019) Zoomed In

From the daily chart, we notice since Sep 6 NZD/USD has failed in multiple occasions nearby the high end of current trading zone 0.6236 – 0.6438. The price changed direction eyeing a test of the low end.
Hence, a close below the low end of the zone could send NZDUSD towards 0.6136. Further close below this level may see the pair trading even lower towards 0.5989. Nonetheless, the weekly support levels underlined on the chart (zoomed in) should be considered.
On the flip-side, any failure to close below the low end of the zone could reverse the pair’s course sending it towards the high end of the zone. Further close above the high end could send NZDUSD towards the vicinity of 0.6555-65. That said, buyers need to keep an eye on the weekly resistance area and level marked on the chart.
Written By: Mahmoud Alkudsi
Please feel free to contact me on Twitter: @Malkudsi